
Page 21 - Azerbaijan State University of Economics
P. 21
THE JOURNAL OF ECONOMIC SCIENCES: THEORY AND PRACTICE, V.70, # 1, 2013, pp. 4-22
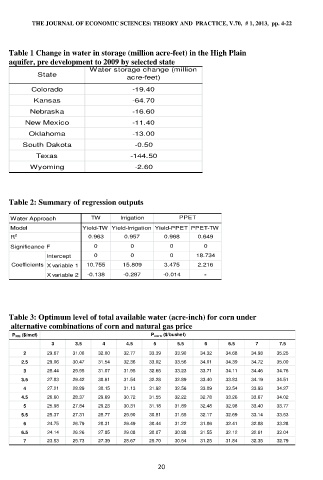
Table 1 Change in water in storage (million acre-feet) in the High Plain
aquifer, pre development to 2009 by selected state
Water storage change (million
State acre-feet)
Colorado -19.40
Kansas -64.70
Nebraska -16.60
New Mexico -11.40
Oklahoma -13.00
South Dakota -0.50
Texas -144.50
Wyoming -2.60
Table 2: Summary of regression outputs
Water Approach TW Irrigation PPET
Model Yield-TW Yield-Irrigation Yield-PPET PPET-TW
R 2 0.963 0.957 0.968 0.649
Significance F 0 0 0 0
Intercept 0 0 0 18.734
Coefficients X variable 1 10.755 15.809 3.475 2.216
X variable 2 -0.138 -0.287 -0.014 -
Table 3: Optimum level of total available water (acre-inch) for corn under
alternative combinations of corn and natural gas price
P NG ($/mcf) P corn ($/bushel)
3 3.5 4 4.5 5 5.5 6 6.5 7 7.5
2 29.67 31.00 32.00 32.77 33.39 33.90 34.32 34.68 34.98 35.25
2.5 29.06 30.47 31.54 32.36 33.02 33.56 34.01 34.39 34.72 35.00
3 28.44 29.95 31.07 31.95 32.65 33.23 33.71 34.11 34.46 34.76
3.5 27.83 29.42 30.61 31.54 32.28 32.89 33.40 33.83 34.19 34.51
4 27.21 28.89 30.15 31.13 31.92 32.56 33.09 33.54 33.93 34.27
4.5 26.60 28.37 29.69 30.72 31.55 32.22 32.78 33.26 33.67 34.02
5 25.98 27.84 29.23 30.31 31.18 31.89 32.48 32.98 33.40 33.77
5.5 25.37 27.31 28.77 29.90 30.81 31.55 32.17 32.69 33.14 33.53
6 24.75 26.79 28.31 29.49 30.44 31.22 31.86 32.41 32.88 33.28
6.5 24.14 26.26 27.85 29.08 30.07 30.88 31.55 32.12 32.61 33.04
7 23.53 25.73 27.39 28.67 29.70 30.54 31.25 31.84 32.35 32.79
20