
Page 102 - Azerbaijan State University of Economics
P. 102
Bryan Davis: State owned enterprises: Chinese fdi in Canada via the lenses of perceptual, political,
economic and social considerations
France 17.2 16.7 17.6 17.3 15.3 -11%
Japan 13.6 12.4 14.5 12.6 12.8 -6%
China 4.2 5.7 12.2 11.7 10.9 160%
All other countries 58.7 73.7 75.9 78 83.3 42%
Foreign Direct Investment: from China
In recent years, China’s SOEs have started to extend their reach to global markets to secure access
to raw materials, resources and new technologies. With its ever-growing appetite for energy and with over
$3.2 trillion in foreign exchange reserves, China has an abundance of excess cash on hand to invest in
invest in strategic sectors.
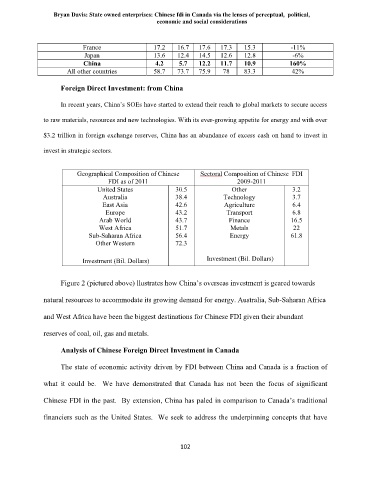
Geographical Composition of Chinese Sectoral Composition of Chinese FDI
FDI as of 2011 2009-2011
United States 30.5 Other 3.2
Australia 38.4 Technology 3.7
East Asia 42.6 Agriculture 6.4
Europe 43.2 Transport 6.8
Arab World 43.7 Finance 16.5
West Africa 51.7 Metals 22
Sub-Saharan Africa 56.4 Energy 61.8
Other Western 72.3
Investment (Bil. Dollars) Investment (Bil. Dollars)
Figure 2 (pictured above) llustrates how China’s overseas investment is geared towards
natural resources to accommodate its growing demand for energy. Australia, Sub-Saharan Africa
and West Africa have been the biggest destinations for Chinese FDI given their abundant
reserves of coal, oil, gas and metals.
Analysis of Chinese Foreign Direct Investment in Canada
The state of economic activity driven by FDI between China and Canada is a fraction of
what it could be. We have demonstrated that Canada has not been the focus of significant
Chinese FDI in the past. By extension, China has paled in comparison to Canada’s traditional
financiers such as the United States. We seek to address the underpinning concepts that have
102