
Page 12 - Azerbaijan State University of Economics
P. 12
THE JOURNAL OF ECONOMIC SCIENCES: THEORY AND PRACTICE, V.76, # 2, 2019, pp. 4-20
2009
2009
2017
2017
23 = 260.05 23 = 551.65 23 = 475.05 23 = 963.08
2017
2017
2009
2009
24 = 280.00 24 = 593.97 25 = 550 25 = 1115.02
2017
2017
25 = 550 25 = 1115.02
= 1043.29
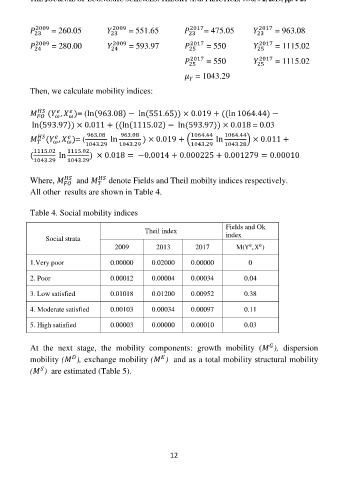
Then, we calculate mobility indices:
( , )= (ln(963.08) − ln(551.65)) × 0.019 + ((ln 1064.44) −
ln(593.97)) × 0.011 + ((ln(1115.02) − ln(593.97)) × 0.018 = 0.03
963.08
963.08
( , )= ( 1043.29 ln 1043.29 ) × 0.019 + ( 1064.44 ln 1064.44 ) × 0.011 +
1043.28
1043.29
1115.02 1115.02
( ln ) × 0.018 = −0.0014 + 0.000225 + 0.001279 = 0.00010
1043.29 1043.29
Where, and denote Fields and Theil mobilty indices respectively.
All other results are shown in Table 4.
Table 4. Social mobility indices
Fields and Ok
Theil index
Social strata index
2009 2013 2017 M(Y , X )
e
e
1.Very poor 0.00000 0.02000 0.00000 0
2. Poor 0.00012 0.00004 0.00034 0.04
3. Low satisfied 0.01018 0.01200 0.00952 0.38
4. Moderate satisfied 0.00103 0.00034 0.00097 0.11
5. High satisfied 0.00003 0.00000 0.00010 0.03
At the next stage, the mobility components: growth mobility ( ), dispersion
mobility ( ), exchange mobility ( ) and as a total mobility structural mobility
( ) are estimated (Table 5).
12