
Page 35 - Azerbaijan State University of Economics
P. 35
THE JOURNAL OF ECONOMIC SCIENCES: THEORY AND PRACTICE, V.78, # 1, 2021, pp. 27-39
In fact, we rely on the DPD system estimation to detect the impact of FDI and ODA
on government size. The long run coefficients are calculated by the equation: long
run parameter (coefficient) = determinant (independent variable) coefficient / 1-
dependent variable coefficient, Sabra, (2015).
DATA
This article uses panel data of seven selected middle income MENA countries,
which are (Algeria, Egypt, Jordan, Lebanon, Morocco, Palestine, and Tunisia) for
the period from 2000 to 2019. We use government size, inward FDI flows,
openness, ODA and country size variables. ODA is the net official development
assistance and official aid received. Trade openness measured by the sum of exports
plus imports as a share of GDP. Government size is general government final
consumption expenditure as a share of GDP. Population as a proxy of country size.
The proxies of variables are widely used in the previous literature. All row data of
variables are collected from World Development Indicators of the World Bank,
except FDI inflows, which collected from UNCTAD database, besides openness and
government size, which are calculated as exports plus imports, and government
expenditure divided on GDP, respectively. Limited missing values are still standing.
All variables are taken in logarithm. We use the variables in algorithm to get the
elasticities, guarantee linearity and reducing any potential multicollinearity. STATA
software has been used for the analyses.
RESULTS
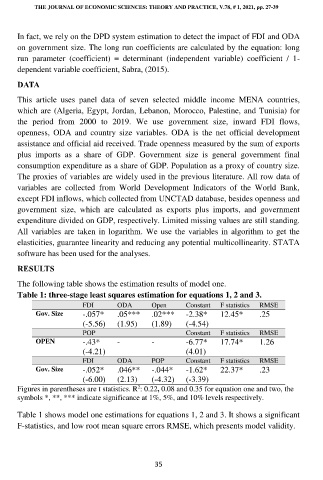
The following table shows the estimation results of model one.
Table 1: three-stage least squares estimation for equations 1, 2 and 3.
FDI ODA Open Constant F statistics RMSE
Gov. Size -.057* .05*** .02*** -2.38* 12.45* .25
(-5.56) (1.95) (1.89) (-4.54)
POP Constant F statistics RMSE
OPEN -.43* - - -6.77* 17.74* 1.26
(-4.21) (4.01)
FDI ODA POP Constant F statistics RMSE
Gov. Size -.052* .046** -.044* -1.62* 22.37* .23
(-6.00) (2.13) (-4.32) (-3.39)
Figures in parentheses are t statistics. R : 0.22, 0.08 and 0.35 for equation one and two, the
2
symbols *, **, *** indicate significance at 1%, 5%, and 10% levels respectively.
Table 1 shows model one estimations for equations 1, 2 and 3. It shows a significant
F-statistics, and low root mean square errors RMSE, which presents model validity.
35