
Page 102 - Azerbaijan State University of Economics
P. 102
THE JOURNAL OF ECONOMIC SCIENCES: THEORY AND PRACTICE, V.80, # 1, 2023, pp. 94-105
Correlation Analysis:
The Pearson correlation coefficient is the most common way of measuring a linear
correlation. It ranges from -1 to +1, where -1 indicates a perfect negative correlation,
0 indicates no correlation, and +1 indicates a perfect positive correlation. Pearson's
correlation coefficient assumes that the data is normally distributed and there is a
linear relationship between the two variables.
On the other hand, Spearman's correlation coefficient is a non-parametric measure of
the strength and direction of the relationship between two variables. It measures the
monotonic relationship between two continuous or ordinal variables. The Spearman
correlation coefficient ranges from -1 to +1, where -1 indicates a perfect negative
monotonic correlation, 0 indicates no monotonic correlation, and +1 indicates a
perfect positive monotonic correlation. Spearman's correlation coefficient does not
assume that the data is normally distributed and can capture non-linear relationships
between the two variables.
To know which method to choose, it is first necessary to clarify whether the data is
parametric or non-parametric. For this, we will use the Shapiro-Wilk normality test.
If the p-value is less than 0.05, then the data is non-parametric.
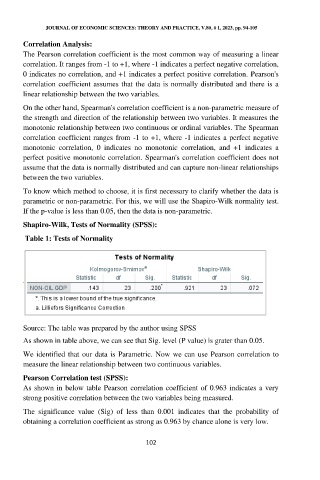
Shapiro-Wilk, Tests of Normality (SPSS):
Table 1: Tests of Normality
Source: The table was prepared by the author using SPSS
As shown in table above, we can see that Sig. level (P value) is grater than 0.05.
We identified that our data is Parametric. Now we can use Pearson correlation to
measure the linear relationship between two continuous variables.
Pearson Correlation test (SPSS):
As shown in below table Pearson correlation coefficient of 0.963 indicates a very
strong positive correlation between the two variables being measured.
The significance value (Sig) of less than 0.001 indicates that the probability of
obtaining a correlation coefficient as strong as 0.963 by chance alone is very low.
102