
Page 8 - Azerbaijan State University of Economics
P. 8
THE JOURNAL OF ECONOMIC SCIENCES: THEORY AND PRACTICE, V.80, # 1, 2023, pp. 4-20
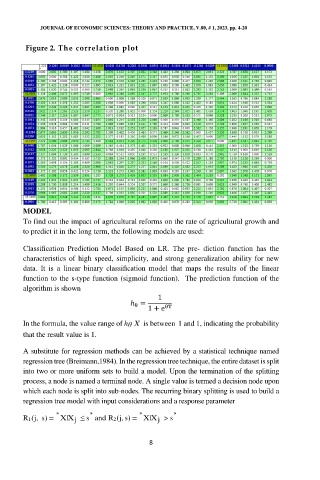
Figure 2. The correlation plot
MODEL
To find out the impact of agricultural reforms on the rate of agricultural growth and
to predict it in the long term, the following models are used:
Classification Prediction Model Based on LR. The pre- diction function has the
characteristics of high speed, simplicity, and strong generalization ability for new
data. It is a linear binary classification model that maps the results of the linear
function to the s-type function (sigmoid function). The prediction function of the
algorithm is shown
1
ℎ =
θ
1 + e θT
In the formula, the value range of h X is between 1 and 1, indicating the probability
θ
that the result value is 1.
A substitute for regression methods can be achieved by a statistical technique named
regression tree (Breimann,1984). In the regression tree technique, the entire dataset is split
into two or more uniform sets to build a model. Upon the termination of the splitting
process, a node is named a terminal node. A single value is termed a decision node upon
which each node is split into sub-nodes. The recurring binary splitting is used to build a
regression tree model with input considerations and a response parameter
, , , ,
R1(j, s) = X|X ≤ s and R2(j, s) = X|X > s
j
j
8