
Page 134 - Azerbaijan State University of Economics
P. 134
THE PUBLIC INVESTMENTS IN AZERBAIJAN: THEORETICAL AND PRACTICAL ASPECTS
50
43.2 42
48 48
37.7
40
30
20
10.6 13.6 12.9 12.9 12.7 12
14.8
7.6
10
6.7 2.4
1.6 2.3 2.5 10.3
1
0
2001 2002 2003 2004 2005 2006 2007 2008 2009 201
GDP State budget
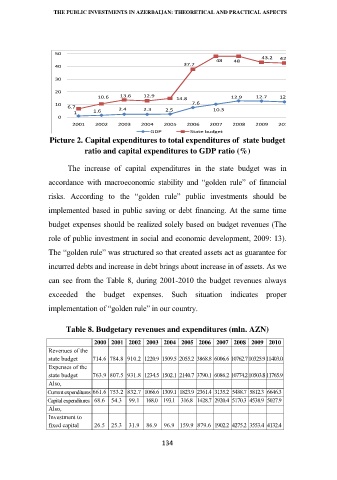
Picture 2. Capital expenditures to total expenditures of state budget
ratio and capital expenditures to GDP ratio (%)
The increase of capital expenditures in the state budget was in
accordance with macroeconomic stability and “golden rule” of financial
risks. According to the “golden rule” public investments should be
implemented based in public saving or debt financing. At the same time
budget expenses should be realized solely based on budget revenues (The
role of public investment in social and economic development, 2009: 13).
The “golden rule” was structured so that created assets act as guarantee for
incurred debts and increase in debt brings about increase in of assets. As we
can see from the Table 8, during 2001-2010 the budget revenues always
exceeded the budget expenses. Such situation indicates proper
implementation of “golden rule” in our country.
Table 8. Budgetary revenues and expenditures (mln. AZN)
2000 2001 2002 2003 2004 2005 2006 2007 2008 2009 2010
Revenues of the
state budget 714.6 784.8 910.2 1220.9 1509.5 2055.2 3868.8 6006.6 10762.710325.9 11403.0
Expenses of the
state budget 763.9 807.5 931.8 1234.5 1502.1 2140.7 3790.1 6086.2 10774.210503.8 11765.9
Also,
Current expenditures 661.6 753.2 832.7 1066.6 1309.1 1823.9 2361.4 3135.2 5488.7 5812.3 6646.3
Capital expenditures 68.6 54.3 99.1 168.0 193.1 316.8 1428.7 2920.4 5170.3 4538.9 5027.9
Also,
Investment to
fixed capital 26.5 25.3 31.9 86.9 96.9 159.9 879.6 1902.2 4275.2 3553.4 4132.4
134