
Page 137 - Azerbaijan State University of Economics
P. 137
THE JOURNAL OF ECONOMIC SCIENCES: THEORY AND PRACTICE
As we can see from the table above the share of government sector
in capital investment in 2000 was equal to 41.7%, in 2004 it decreased to
9.3% and in 2010 it increased up to 60.6%. Such trend is explained by
the foreign investments into the oil and gas industry. Thus, effective
from 2004 majority of oil and gas projects started their production and
this brought about significant increase in revenues, which provided
opportunities to expand the investment activities of the government.
Implementation of the oil and gas projects in Azerbaijan led to stability
of foreign investments made to this sector. For example, in 2010 total
nominal amount of capital investments done by the public agencies
increased by 13.2 times in comparison with 2004, similar index for
foreign and joint ventures decreased by 1.6 times. Therefore increase in
this realm during the indicated period was basically due to government
investment activities.
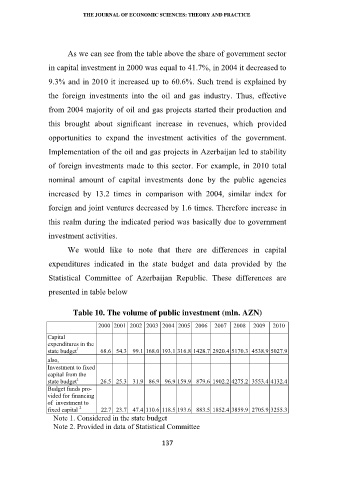
We would like to note that there are differences in capital
expenditures indicated in the state budget and data provided by the
Statistical Committee of Azerbaijan Republic. These differences are
presented in table below
Table 10. The volume of public investment (mln. AZN)
2000 2001 2002 2003 2004 2005 2006 2007 2008 2009 2010
Capital
expenditures in the
state budget 1 68.6 54.3 99.1 168.0 193.1 316.8 1428.7 2920.4 5170.3 4538.9 5027.9
also,
Investment to fixed
capital from the
state budget 1 26.5 25.3 31.9 86.9 96.9 159.9 879.6 1902.2 4275.2 3553.4 4132.4
Budget funds pro-
vided for financing
of investment to
fixed capital 2 22.7 23.7 47.4 110.6 118.5 193.6 883.5 1852.4 3859.9 2705.9 3255.3
Note 1. Considered in the state budget
Note 2. Provided in data of Statistical Committee
137