
Page 56 - Azerbaijan State University of Economics
P. 56
Hashim Al-Ali: An integrated macro-fiscal forecasting model and its application for
the Bangladesh economy
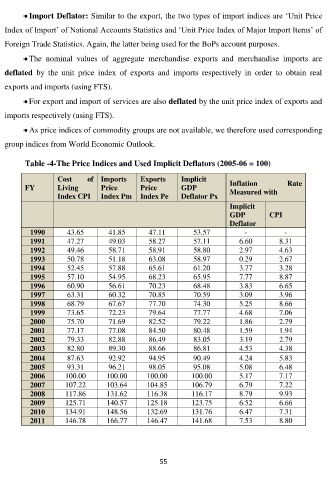
Import Deflator: Similar to the export, the two types of import indices are ‘Unit Price
Index of Import’ of National Accounts Statistics and ‘Unit Price Index of Major Import Items’ of
Foreign Trade Statistics. Again, the latter being used for the BoPs account purposes.
The nominal values of aggregate merchandise exports and merchandise imports are
deflated by the unit price index of exports and imports respectively in order to obtain real
exports and imports (using FTS).
For export and import of services are also deflated by the unit price index of exports and
imports respectively (using FTS).
As price indices of commodity groups are not available, we therefore used corresponding
group indices from World Economic Outlook.
Table -4-The Price Indices and Used Implicit Deflators (2005-06 = 100)
Cost of Imports Exports Implicit Inflation Rate
FY Living Price Price GDP Measured with
Index CPI Index Pm Index Pe Deflator Px
Implicit
GDP CPI
Deflator
1990 43.65 41.85 47.11 53.57 - -
1991 47.27 49.03 58.27 57.11 6.60 8.31
1992 49.46 58.71 58.91 58.80 2.97 4.63
1993 50.78 51.18 63.08 58.97 0.29 2.67
1994 52.45 57.88 65.61 61.20 3.77 3.28
1995 57.10 54.95 68.23 65.95 7.77 8.87
1996 60.90 56.61 70.23 68.48 3.83 6.65
1997 63.31 60.32 70.85 70.59 3.09 3.96
1998 68.79 67.67 77.70 74.30 5.25 8.66
1999 73.65 72.23 79.64 77.77 4.68 7.06
2000 75.70 71.69 82.52 79.22 1.86 2.79
2001 77.17 77.08 84.50 80.48 1.59 1.94
2002 79.33 82.88 86.49 83.05 3.19 2.79
2003 82.80 89.30 88.66 86.81 4.53 4.38
2004 87.63 92.92 94.95 90.49 4.24 5.83
2005 93.31 96.21 98.05 95.08 5.08 6.48
2006 100.00 100.00 100.00 100.00 5.17 7.17
2007 107.22 103.64 104.85 106.79 6.79 7.22
2008 117.86 131.62 116.38 116.17 8.79 9.93
2009 125.71 140.57 125.18 123.75 6.52 6.66
2010 134.91 148.56 132.69 131.76 6.47 7.31
2011 146.78 166.77 146.47 141.68 7.53 8.80
55