
Page 46 - Azerbaijan State University of Economics
P. 46
THE JOURNAL OF ECONOMIC SCIENCES: THEORY AND PRACTICE, V.71, # 1, 2014, pp. 40-52
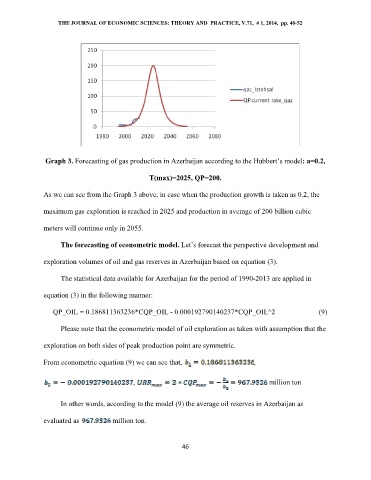
Graph 3. Forecasting of gas production in Azerbaijan according to the Hubbert’s model: a=0.2,
T(max)=2025, QP=200.
As we can see from the Graph 3 above, in case when the production growth is taken as 0.2, the
maximum gas exploration is reached in 2025 and production in average of 200 billion cubic
meters will continue only in 2055.
The forecasting of econometric model. Let’s forecast the perspective development and
exploration volumes of oil and gas reserves in Azerbaijan based on equation (3).
The statistical data available for Azerbaijan for the period of 1990-2013 are applied in
equation (3) in the following manner:
QP_OIL = 0.186811363236*CQP_OIL - 0.000192790140237*CQP_OIL^2 (9)
Please note that the econometric model of oil exploration as taken with assumption that the
exploration on both sides of peak production point are symmetric.
From econometric equation (9) we can see that, ,
, million ton
In other words, according to the model (9) the average oil reserves in Azerbaijan as
evaluated as million ton.
46