
Page 71 - Azerbaijan State University of Economics
P. 71
THE JOURNAL OF ECONOMIC SCIENCES: THEORY AND PRACTICE, V.71, # 1, 2014, pp. 53-79
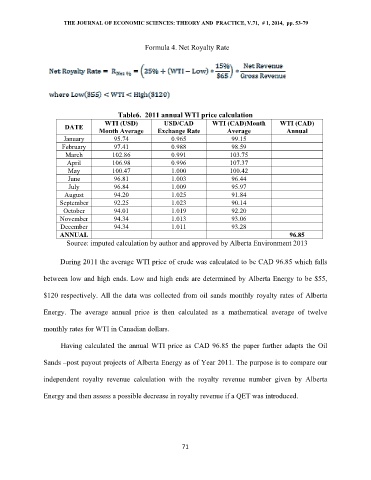
Formula 4. Net Royalty Rate
Table6. 2011 annual WTI price calculation
WTI (USD) USD/CAD WTI (CAD)Month WTI (CAD)
DATE
Month Average Exchange Rate Average Annual
January 95.74 0.965 99.15
February 97.41 0.988 98.59
March 102.86 0.991 103.75
April 106.98 0.996 107.37
May 100.47 1.000 100.42
June 96.81 1.003 96.44
July 96.84 1.009 95.97
August 94.20 1.025 91.84
September 92.25 1.023 90.14
October 94.01 1.019 92.20
November 94.34 1.013 93.06
December 94.34 1.011 93.28
ANNUAL 96.85
Source: imputed calculation by author and approved by Alberta Environment 2013
During 2011 the average WTI price of crude was calculated to be CAD 96.85 which falls
between low and high ends. Low and high ends are determined by Alberta Energy to be $55,
$120 respectively. All the data was collected from oil sands monthly royalty rates of Alberta
Energy. The average annual price is then calculated as a mathematical average of twelve
monthly rates for WTI in Canadian dollars.
Having calculated the annual WTI price as CAD 96.85 the paper further adapts the Oil
Sands –post payout projects of Alberta Energy as of Year 2011. The purpose is to compare our
independent royalty revenue calculation with the royalty revenue number given by Alberta
Energy and then assess a possible decrease in royalty revenue if a QET was introduced.
71