
Page 47 - Azerbaijan State University of Economics
P. 47
THE JOURNAL OF ECONOMIC SCIENCES: THEORY AND PRACTICE, V.73, # 1, 2016, pp. 45-51
Statistical Committee of the Republic of Azerbaijan, there was 4% rise in non-oil
GDP. Notably, similar rise was recorded in 2001 (68.7%, SSCRA, 2016).
Foreign Trade
The foreign trade turnover in 2015 decreased by 33.4% compared to the
previous year, being 20.6 billion USD. This noticeable contraction in foreign trade
turnover was due to the shrinking of exports. In other words, the amount of exports
decreased to 10.6 billion USD, or by 48.7% during 2015. The major reason of this
plunge is the sharp drop in international oil prices. Comparing to 11 months‘ of
2014, in 2015 the volume of oil, oil products and gas exports diminished by 53.8%,
being 9.1 billion USD (2014, 19.77 billion USD, SCCRA). [Regional Economic
Diversity and Regional Economic Stability, 2003]
In contrast to exports, there was an increase in imports. That is to say, during
11 months‘ of 2015 the volume of imports rose by 1% from previous year, being 8.2
billion USD. Considering macroeconomic situation has not changed considerably at
the last month of 2015, the final outcomes of 2015 can be grounded on 11 months‘
trend.
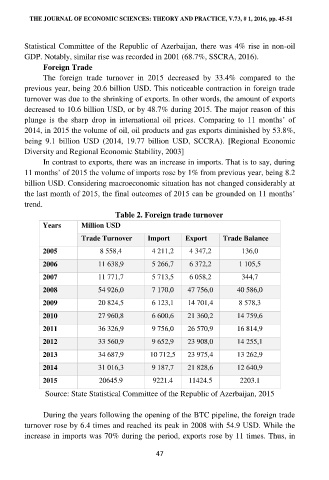
Table 2. Foreign trade turnover
Years Million USD
Trade Turnover Import Export Trade Balance
2005 8 558,4 4 211,2 4 347,2 136,0
2006 11 638,9 5 266,7 6 372,2 1 105,5
2007 11 771,7 5 713,5 6 058,2 344,7
2008 54 926,0 7 170,0 47 756,0 40 586,0
2009 20 824,5 6 123,1 14 701,4 8 578,3
2010 27 960,8 6 600,6 21 360,2 14 759,6
2011 36 326,9 9 756,0 26 570,9 16 814,9
2012 33 560,9 9 652,9 23 908,0 14 255,1
2013 34 687,9 10 712,5 23 975,4 13 262,9
2014 31 016,3 9 187,7 21 828,6 12 640,9
2015 20645.9 9221.4 11424.5 2203.1
Source: State Statistical Committee of the Republic of Azerbaijan, 2015
During the years following the opening of the BTC pipeline, the foreign trade
turnover rose by 6.4 times and reached its peak in 2008 with 54.9 USD. While the
increase in imports was 70% during the period, exports rose by 11 times. Thus, in
47