
Page 17 - Azerbaijan State University of Economics
P. 17
Hashim Al-Ali: Towards a realistic medium term macroeconomic and fiscal framework and
outlook for the Somali national economy (2017- 2019)
• The Structure of the Somali GDP by Expenditure (Final Demand) Components
Development, stability and diversification of the Somali national economy require enhancing
both; public and private investment, where investment become the main source and the vehicle
for economic growth and development of the nation, and planned to be so during the defined
period of the SNDP.
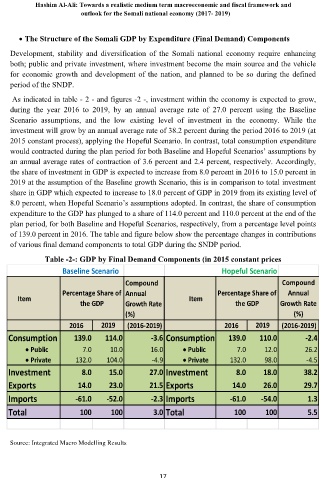
As indicated in table - 2 - and figures -2 -, investment within the economy is expected to grow,
during the year 2016 to 2019, by an annual average rate of 27.0 percent using the Baseline
Scenario assumptions, and the low existing level of investment in the economy. While the
investment will grow by an annual average rate of 38.2 percent during the period 2016 to 2019 (at
2015 constant process), applying the Hopeful Scenario. In contrast, total consumption expenditure
would contracted during the plan period for both Baseline and Hopeful Scenarios’ assumptions by
an annual average rates of contraction of 3.6 percent and 2.4 percent, respectively. Accordingly,
the share of investment in GDP is expected to increase from 8.0 percent in 2016 to 15.0 percent in
2019 at the assumption of the Baseline growth Scenario, this is in comparison to total investment
share in GDP which expected to increase to 18.0 percent of GDP in 2019 from its existing level of
8.0 percent, when Hopeful Scenario’s assumptions adopted. In contrast, the share of consumption
expenditure to the GDP has plunged to a share of 114.0 percent and 110.0 percent at the end of the
plan period, for both Baseline and Hopeful Scenarios, respectively, from a percentage level points
of 139.0 percent in 2016. The table and figure below show the percentage changes in contributions
of various final demand components to total GDP during the SNDP period.
Table -2-: GDP by Final Demand Components (in 2015 constant prices
Baseline Scenario Hopeful Scenario
Compound Compound
Percentage Share of Annual Percentage Share of Annual
Item Item
the GDP Growth Rate the GDP Growth Rate
(%) (%)
2016 2019 (2016-2019) 2016 2019 (2016-2019)
Consumption 139.0 114.0 -3.6 Consumption 139.0 110.0 -2.4
• Public 7.0 10.0 16.0 • Public 7.0 12.0 26.2
• Private 132.0 104.0 -4.9 • Private 132.0 98.0 -4.5
Investment 8.0 15.0 27.0 Investment 8.0 18.0 38.2
Exports 14.0 23.0 21.5 Exports 14.0 26.0 29.7
Imports -61.0 -52.0 -2.3 Imports -61.0 -54.0 1.3
Total 100 100 3.0 Total 100 100 5.5
Source: Integrated Macro Modelling Results
17