
Page 24 - Azerbaijan State University of Economics
P. 24
Aynur Suleymanova: Assessment of Laffer Points of the I and II Types of VAT (on the
Example of Russian Federation, Kazakhstan and Azerbaijan Republics
Here GDP_CURP_NC_RF is GDP at current prices of the Russian Federation,
VAT_TB_RF is the level of tax burden on VAT in Russian Federation.
The following result was obtained from the econometric evaluation of the regression
equation (1):
LOG(GDP_CURP_NC_RF) = 6.41058559254* VAT_TB _RF - 0.575389897779* VAT_
TB _RF^2 + [AR (1) =0.902725244679] (2)
(t-Statistic) (46.74186) (-35.33396)
R-squared = 0.707600; Adjusted R-squared = 0.597950; Durbin-Watson stat = 1.779558
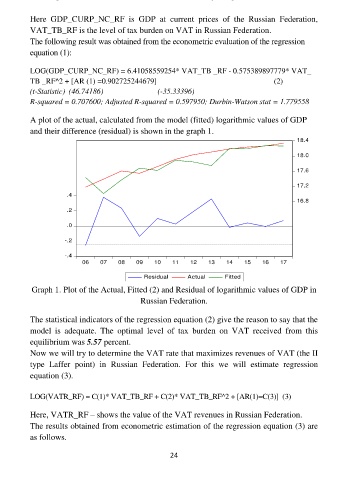
A plot of the actual, calculated from the model (fitted) logarithmic values of GDP
and their difference (residual) is shown in the graph 1.
18.4
18.0
17.6
17.2
.4
16.8
.2
.0
-.2
-.4
06 07 08 09 10 11 12 13 14 15 16 17
Residual Actual Fitted
Graph 1. Plot of the Actual, Fitted (2) and Residual of logarithmic values of GDP in
Russian Federation.
The statistical indicators of the regression equation (2) give the reason to say that the
model is adequate. The optimal level of tax burden on VAT received from this
equilibrium was 5.57 percent.
Now we will try to determine the VAT rate that maximizes revenues of VAT (the II
type Laffer point) in Russian Federation. For this we will estimate regression
equation (3).
LOG(VATR_RF) = C(1)* VAT_TB_RF + C(2)* VAT_TB_RF^2 + [AR(1)=C(3)] (3)
Here, VATR_RF – shows the value of the VAT revenues in Russian Federation.
The results obtained from econometric estimation of the regression equation (3) are
as follows.
24