Page 27 - Azerbaijan State University of Economics
P. 27

THE JOURNAL OF ECONOMIC SCIENCES: THEORY AND PRACTICE, V.78, # 2, 2021, pp. 17-42


                    On  the  other  hand,  short  sample  period  does  not  allow  us  to  use  non-linear  or
                    Markov Switching models. Due to these constraints, we will conduct our estimations
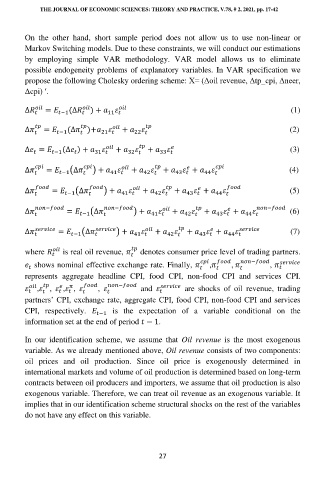
                    by  employing  simple  VAR  methodology.  VAR  model  allows  us  to  eliminate
                    possible endogeneity problems of explanatory variables.  In VAR specification we
                    propose the following Cholesky ordering scheme: X= (Δoil revenue, Δtp_cpi, Δneer,
                    Δcpi) ′.

                    ∆              =      −1 (∆             ) +                                                                                               (1)
                                            11   


                    ∆         =      −1 (∆   )+              +                                                                           (2)
                                          21   
                                      
                                                    22   
                         
                                                                 
                    ∆   =      −1 (∆   ) +               +             +                                                                (3)
                                                            33   
                                        31   
                        
                                    
                                                  32   
                                                                      
                    ∆           =      −1 (∆          ) +               +             +       +                                              (4)
                         
                                       
                                             41   
                                                                43   
                                                                         44   
                                                       42   
                                                                         
                    ∆             =     (∆            ) +               +             +       +                                        (5)
                                  −1            41        42        43      44   
                                                                                  
                    ∆         −          =      −1 (∆            −         ) +               +             +       +             −           (6)
                                                                   42   
                                                         41   
                                                                            43   
                                                                                     44   
                         
                                                                             
                    ∆                      =      −1 (∆                     ) +               +             +       +                                     (7)
                                                                                44   
                                                                       43   
                                                    41   
                                                              42   
                                                       
                    where               is real oil revenue,     denotes consumer price level of trading partners.
                                                     
                                                                                                −                        
                        shows nominal effective exchange rate. Finally,        ,       ,        ,      
                       
                    represents  aggregate  headline  CPI,  food  CPI,  non-food  CPI  and  services  CPI.


                                 ,   ,     ,   ,                 ,              −           and                         are  shocks  of  oil  revenue,  trading


                    partners’ CPI, exchange rate, aggregate CPI, food CPI, non-food CPI and services
                    CPI,  respectively.       −1   is  the  expectation  of  a  variable  conditional  on  the
                    information set at the end of period    − 1.

                    In  our  identification  scheme,  we  assume  that  Oil  revenue  is  the  most  exogenous
                    variable. As we already mentioned above, Oil revenue consists of two components:
                    oil  prices  and  oil  production.  Since  oil  price  is  exogenously  determined  in
                    international markets and volume of oil production is determined based on long-term
                    contracts between oil producers and importers, we assume that oil production is also
                    exogenous variable. Therefore, we can treat oil revenue as an exogenous variable. It
                    implies that in our identification scheme structural shocks on the rest of the variables
                    do not have any effect on this variable.


                                                           27
   22   23   24   25   26   27   28   29   30   31   32