
Page 30 - Azerbaijan State University of Economics
P. 30
Vugar Rahimov, Nigar Jafarova: The Exchange Rate Pass-Through to Aggregate
Consumer Price Index and Its Components In Azerbaijan
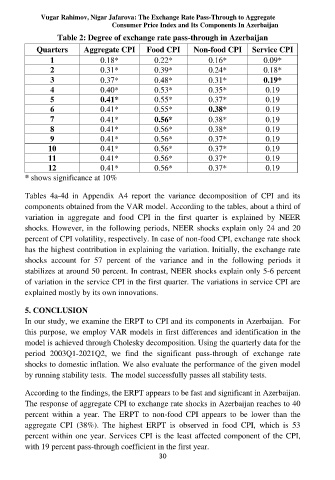
Table 2: Degree of exchange rate pass-through in Azerbaijan
Quarters Aggregate CPI Food CPI Non-food CPI Service CPI
1 0.18* 0.22* 0.16* 0.09*
2 0.31* 0.39* 0.24* 0.18*
3 0.37* 0.48* 0.31* 0.19*
4 0.40* 0.53* 0.35* 0.19
5 0.41* 0.55* 0.37* 0.19
6 0.41* 0.55* 0.38* 0.19
7 0.41* 0.56* 0.38* 0.19
8 0.41* 0.56* 0.38* 0.19
9 0.41* 0.56* 0.37* 0.19
10 0.41* 0.56* 0.37* 0.19
11 0.41* 0.56* 0.37* 0.19
12 0.41* 0.56* 0.37* 0.19
* shows significance at 10%
Tables 4a-4d in Appendix A4 report the variance decomposition of CPI and its
components obtained from the VAR model. According to the tables, about a third of
variation in aggregate and food CPI in the first quarter is explained by NEER
shocks. However, in the following periods, NEER shocks explain only 24 and 20
percent of CPI volatility, respectively. In case of non-food CPI, exchange rate shock
has the highest contribution in explaining the variation. Initially, the exchange rate
shocks account for 57 percent of the variance and in the following periods it
stabilizes at around 50 percent. In contrast, NEER shocks explain only 5-6 percent
of variation in the service CPI in the first quarter. The variations in service CPI are
explained mostly by its own innovations.
5. CONCLUSION
In our study, we examine the ERPT to CPI and its components in Azerbaijan. For
this purpose, we employ VAR models in first differences and identification in the
model is achieved through Cholesky decomposition. Using the quarterly data for the
period 2003Q1-2021Q2, we find the significant pass-through of exchange rate
shocks to domestic inflation. We also evaluate the performance of the given model
by running stability tests. The model successfully passes all stability tests.
According to the findings, the ERPT appears to be fast and significant in Azerbaijan.
The response of aggregate CPI to exchange rate shocks in Azerbaijan reaches to 40
percent within a year. The ERPT to non-food CPI appears to be lower than the
aggregate CPI (38%). The highest ERPT is observed in food CPI, which is 53
percent within one year. Services CPI is the least affected component of the CPI,
with 19 percent pass-through coefficient in the first year.
30