
Page 82 - Azerbaijan State University of Economics
P. 82
THE JOURNAL OF ECONOMIC SCIENCES: THEORY AND PRACTICE, V.78, # 2, 2021, pp. 74-88
During 2001-2006, the total number of jobs created in this sector increased by nearly
32%. In the next eleven years, total employment created by the firms has increased
by 147.4%. This significant increment in the number of firms and employment is
due to the government interventions to support the manufacturing sector through a
range of incentives like favorable land lease rates, access to commercial credit,
protect medium and large scale manufacturing industry to sustain in the market,
technology link with kaizen institute, value chain(textile), free imports of inputs,
generous tax breaks, together with substantial investments to improve infrastructure
and human capital (Ansu et al., 2016).
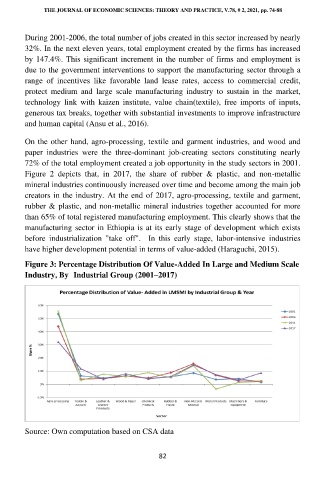
On the other hand, agro-processing, textile and garment industries, and wood and
paper industries were the three-dominant job-creating sectors constituting nearly
72% of the total employment created a job opportunity in the study sectors in 2001.
Figure 2 depicts that, in 2017, the share of rubber & plastic, and non-metallic
mineral industries continuously increased over time and become among the main job
creators in the industry. At the end of 2017, agro-processing, textile and garment,
rubber & plastic, and non-metallic mineral industries together accounted for more
than 65% of total registered manufacturing employment. This clearly shows that the
manufacturing sector in Ethiopia is at its early stage of development which exists
before industrialization "take off". In this early stage, labor-intensive industries
have higher development potential in terms of value-added (Haraguchi, 2015).
Figure 3: Percentage Distribution Of Value-Added In Large and Medium Scale
Industry, By Industrial Group (2001–2017)
Source: Own computation based on CSA data
82