
Page 59 - Azerbaijan State University of Economics
P. 59
THE JOURNAL OF ECONOMIC SCIENCES: THEORY AND PRACTICE, V.79, # 2, 2022, pp. 51-63
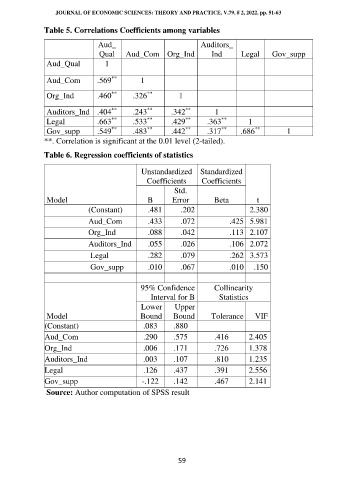
Table 5. Correlations Coefficients among variables
Aud_ Auditors_
Qual Aud_Com Org_Ind Ind Legal Gov_supp
Aud_Qual 1
**
Aud_Com .569 1
**
**
Org_Ind .460 .326 1
**
**
**
Auditors_Ind .404 .243 .342 1
**
**
**
**
Legal .663 .533 .429 .363 1
**
**
**
**
**
Gov_supp .549 .483 .442 .317 .686 1
**. Correlation is significant at the 0.01 level (2-tailed).
Table 6. Regression coefficients of statistics
Unstandardized Standardized
Coefficients Coefficients
Std.
Model B Error Beta t
(Constant) .481 .202 2.380
Aud_Com .433 .072 .425 5.981
Org_Ind .088 .042 .113 2.107
Auditors_Ind .055 .026 .106 2.072
Legal .282 .079 .262 3.573
Gov_supp .010 .067 .010 .150
95% Confidence Collinearity
Interval for B Statistics
Lower Upper
Model Bound Bound Tolerance VIF
(Constant) .083 .880
Aud_Com .290 .575 .416 2.405
Org_Ind .006 .171 .726 1.378
Auditors_Ind .003 .107 .810 1.235
Legal .126 .437 .391 2.556
Gov_supp -.122 .142 .467 2.141
Source: Author computation of SPSS result
59