
Page 110 - Azerbaijan State University of Economics
P. 110
THE JOURNAL OF ECONOMIC SCIENCES: THEORY AND PRACTICE, V.80, # 1, 2023, pp. 106-118
Analytical model
The models logit, probit, discriminant analysis, and regression models can all be used
to analyze quantitative data. When the dependent variable is binary, the models of
logit, probit, and discriminant analysis are appropriate. B. Muthen and L. Muthen,
(2007) advised using a regression model for this type of investigation because the
dependent variable is continuous. Return on Equity was used to clearly evaluate the
performance of the company (Y).
Y =α +β1x1+β2X2+ β 3X3 + ε
Where,
Y = Profitability as measured by Return on Equity of the company
X1 = Change in assets as measured by Asset Growth ratio
X2 = Financial Leverage of the company as measured by the debt to equity ratio
X3= Liquidity as measured by Current ratio of the company.
α = The Intercept or constant
β1…. β3 = the regression coefficients of the independent variables.
ε = Error term
Empirical Study and Discussion
Descriptive statistics
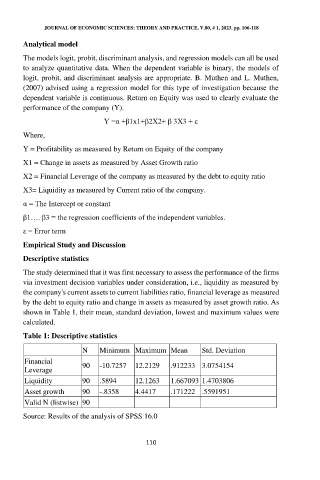
The study determined that it was first necessary to assess the performance of the firms
via investment decision variables under consideration, i.e., liquidity as measured by
the company's current assets to current liabilities ratio, financial leverage as measured
by the debt to equity ratio and change in assets as measured by asset growth ratio. As
shown in Table 1, their mean, standard deviation, lowest and maximum values were
calculated.
Table 1: Descriptive statistics
N Minimum Maximum Mean Std. Deviation
Financial
Leverage 90 -10.7257 12.2129 .912233 3.0754154
Liquidity 90 .5894 12.1263 1.667093 1.4703806
Asset growth 90 -.8358 4.4417 .171222 .5591951
Valid N (listwise) 90
Source: Results of the analysis of SPSS 16.0
110