
Page 112 - Azerbaijan State University of Economics
P. 112
THE JOURNAL OF ECONOMIC SCIENCES: THEORY AND PRACTICE, V.80, # 1, 2023, pp. 106-118
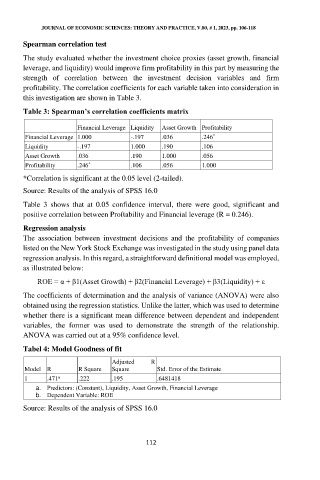
Spearman correlation test
The study evaluated whether the investment choice proxies (asset growth, financial
leverage, and liquidity) would improve firm profitability in this part by measuring the
strength of correlation between the investment decision variables and firm
profitability. The correlation coefficients for each variable taken into consideration in
this investigation are shown in Table 3.
Table 3: Spearman’s correlation coefficients matrix
Financial Leverage Liquidity Asset Growth Profitability
*
Financial Leverage 1.000 -.197 .036 .246
Liquidity -.197 1.000 .190 .106
Asset Growth .036 .190 1.000 .056
*
Profitability .246 .106 .056 1.000
*Correlation is significant at the 0.05 level (2-tailed).
Source: Results of the analysis of SPSS 16.0
Table 3 shows that at 0.05 confidence interval, there were good, significant and
positive correlation between Proftability and Financial leverage (R = 0.246).
Regression analysis
The association between investment decisions and the profitability of companies
listed on the New York Stock Exchange was investigated in the study using panel data
regression analysis. In this regard, a straightforward definitional model was employed,
as illustrated below:
ROE = α + β1(Asset Growth) + β2(Financial Leverage) + β3(Liquidity) + ε
The coefficients of determination and the analysis of variance (ANOVA) were also
obtained using the regression statistics. Unlike the latter, which was used to determine
whether there is a significant mean difference between dependent and independent
variables, the former was used to demonstrate the strength of the relationship.
ANOVA was carried out at a 95% confidence level.
Tabel 4: Model Goodness of fit
Adjusted R
Model R R Square Square Std. Error of the Estimate
a
1 .471 .222 .195 .6481418
a. Predictors: (Constant), Liquidity, Asset Growth, Financial Leverage
b. Dependent Variable: ROE
Source: Results of the analysis of SPSS 16.0
112