
Page 72 - Azerbaijan State University of Economics
P. 72
Kanan Fadani: Impact Of Digital Consumption And Factors Affecting It: The Example
Of Azerbaijan
Data Analysis and Model Testing
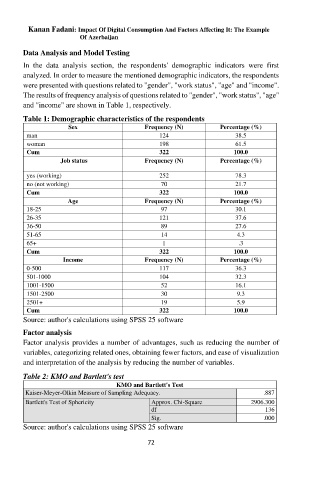
In the data analysis section, the respondents' demographic indicators were first
analyzed. In order to measure the mentioned demographic indicators, the respondents
were presented with questions related to "gender", "work status", "age" and "income".
The results of frequency analysis of questions related to "gender", "work status", "age"
and "income" are shown in Table 1, respectively.
Table 1: Demographic characteristics of the respondents
Sex Frequency (N) Percentage (%)
man 124 38.5
woman 198 61.5
Cum 322 100.0
Job status Frequency (N) Percentage (%)
yes (working) 252 78.3
no (not working) 70 21.7
Cum 322 100.0
Age Frequency (N) Percentage (%)
18-25 97 30.1
26-35 121 37.6
36-50 89 27.6
51-65 14 4.3
65+ 1 .3
Cum 322 100.0
Income Frequency (N) Percentage (%)
0-500 117 36.3
501-1000 104 32.3
1001-1500 52 16.1
1501-2500 30 9.3
2501+ 19 5.9
Cum 322 100.0
Source: author's calculations using SPSS 25 software
Factor analysis
Factor analysis provides a number of advantages, such as reducing the number of
variables, categorizing related ones, obtaining fewer factors, and ease of visualization
and interpretation of the analysis by reducing the number of variables.
Table 2: KMO and Bartlett's test
KMO and Bartlett's Test
Kaiser-Meyer-Olkin Measure of Sampling Adequacy. .887
Bartlett's Test of Sphericity Approx. Chi-Square 2906.300
df 136
Sig. .000
Source: author's calculations using SPSS 25 software
72