
Page 75 - Azerbaijan State University of Economics
P. 75
THE JOURNAL OF ECONOMIC SCIENCES: THEORY AND PRACTICE, V.80, # 1, 2023, pp. 67-82
Table 5 shows the model fit indices of the SEM analysis of the study variables. Model
fit indices CMIN /DF (chi-square, degrees of freedom), GFI (goodness of fit index),
CFI (Comparative Fit Index), RMSEA (root mean square error of approximation)
values were determined. In their study, Tabachnick and Fidell (2007) stated that CFI
and RMSEA indices are the most analyzed goodness-of-fit indices. Hair et al. (2006)
reported that CFI, degrees of freedom-df, CMIN, and RMSEA values provide
sufficient information in assessing model fit.
We can see that the value of CMIN/DF is CMIN/DF= 4.679 during the assessment of
compatibility indices, which is the result of the analysis . If this value is CMIN/DF≤5, it
means that it is an acceptable fit. GFI value was GFI=0.829. If this value is above 0.90, it
is indicated as an accepted value (Şimşek, 2007). If the GFI fit index obtained as a result
of the analysis does not coincide with the accepted value, it is marked as poor fit.
However, in some literature, GFI values between 0.80-0.89 are also considered acceptable
values (Okur and Yalçın-Özdilek, 2012;Segars and Grover, 1993). CFI value was
CFI=0.837. A value above 0.900 is considered an acceptable fit. If the GFI fit index
obtained as a result of the analysis does not coincide with the accepted value, it is marked
as poor fit. The last RMSEA value mentioned in the table was RMSEA=0.107. This value
is considered as an acceptable fit when RMSEA≤0.08.
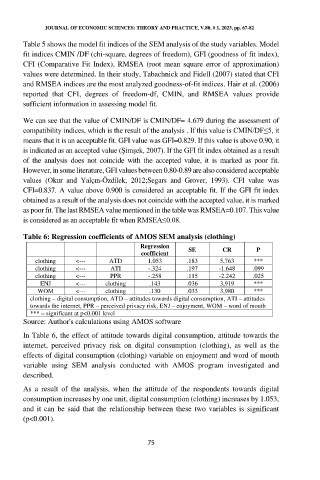
Table 6: Regression coefficients of AMOS SEM analysis (clothing)
Regression SE CR P
coefficient
clothing <--- ATD 1.053 .183 5,763 ***
clothing <--- ATI -.324 .197 -1.648 .099
clothing <--- PPR -.258 .115 -2.242 .025
ENJ <--- clothing .143 .036 3,919 ***
WOM <--- clothing .130 .033 3,980 ***
clothing – digital consumption, ATD – attitudes towards digital consumption, ATI – attitudes
towards the internet, PPR – perceived privacy risk, ENJ – enjoyment, WOM – word of mouth
*** = significant at p<0.001 level
Source: Author's calculations using AMOS software
In Table 6, the effect of attitude towards digital consumption, attitude towards the
internet, perceived privacy risk on digital consumption (clothing), as well as the
effects of digital consumption (clothing) variable on enjoyment and word of mouth
variable using SEM analysis conducted with AMOS program investigated and
described.
As a result of the analysis, when the attitude of the respondents towards digital
consumption increases by one unit, digital consumption (clothing) increases by 1.053,
and it can be said that the relationship between these two variables is significant
(p<0.001).
75