
Page 18 - Azerbaijan State University of Economics
P. 18
THE JOURNAL OF ECONOMIC SCIENCES: THEORY AND PRACTICE, V.81, # 1, 2024, pp. 4-21
Homoscedasticity of the Residuals
To detect whether the residuals suffer from heteroscedasticity, making statistical
inference more reliable, the following tests are used, and the test hypotheses are
formulated as :
- Null Hypothesis : There is no variance in error .
- Alternative Hypothesis : There is variance in error.
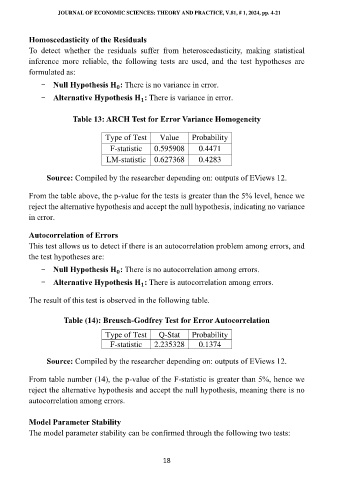
Table 13: ARCH Test for Error Variance Homogeneity
Type of Test Value Probability
F-statistic 0.595908 0.4471
LM-statistic 0.627368 0.4283
Source: Compiled by the researcher depending on: outputs of EViews 12.
From the table above, the p-value for the tests is greater than the 5% level, hence we
reject the alternative hypothesis and accept the null hypothesis, indicating no variance
in error .
Autocorrelation of Errors
This test allows us to detect if there is an autocorrelation problem among errors, and
the test hypotheses are:
- Null Hypothesis : There is no autocorrelation among errors .
- Alternative Hypothesis : There is autocorrelation among errors .
The result of this test is observed in the following table.
Table (14): Breusch-Godfrey Test for Error Autocorrelation
Type of Test Q-Stat Probability
F-statistic 2.235328 0.1374
Source: Compiled by the researcher depending on: outputs of EViews 12.
From table number (14), the p-value of the F-statistic is greater than 5%, hence we
reject the alternative hypothesis and accept the null hypothesis, meaning there is no
autocorrelation among errors .
Model Parameter Stability
The model parameter stability can be confirmed through the following two tests:
18