
Page 28 - Azerbaijan State University of Economics
P. 28
THE JOURNAL OF ECONOMIC SCIENCES: THEORY AND PRACTICE, V.81, # 1, 2024, pp. 22-39
METHODOLOGY
First, this paper describes the trends in the main inbound tourism indicators of Greece
at the EU market. Current situation in the use of various digital marketing channels
by tourism enterprises is shown. Correlations between the tourism sector performance
indicators and trends in using digital and traditional marketing channels are
calculated. Marketing channel efficiency indicators are calculated for recent years as
ratios of the growth rate of the EU tourists’ expenditure in Greece to the change in a
marketing channel use. Regression models are created to assess significance of the
effect of the marketing channels after controlling for the EU tourists’ income factor
(GDP growth in the EU). The difference in efficiency of attracting tourists from the
specific EU member states by the expenditure to marketing services imports from
those countries is also considered.
Eurostat (2024) is the main source of statistical data on the tourism links between
Greece and the EU, tourism sector digital marketing channels and other indicators.
International Trade Centre (2024) was used to get data on total imported advertising,
market research, and public opinion polling services by Greece from the EU as a more
traditional marketing tool. IMF (2023) was used for the EU GDP growth rates.
RESULTS
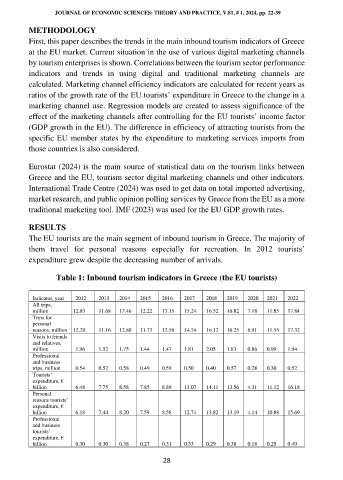
The EU tourists are the main segment of inbound tourism in Greece. The majority of
them travel for personal reasons especially for recreation. In 2012 tourists’
expenditure grew despite the decreasing number of arrivals.
Table 1: Inbound tourism indicators in Greece (the EU tourists)
Indicator, year 2012 2013 2014 2015 2016 2017 2018 2019 2020 2021 2022
All trips,
million 12.83 11.68 13.46 12.22 13.15 15.24 16.52 16.82 7.18 11.85 17.84
Trips for
personal
reasons, million 12.29 11.16 12.88 11.73 12.56 14.74 16.12 16.25 6.91 11.55 17.32
Visits to friends
and relatives,
million 1.96 1.52 1.75 1.44 1.47 1.81 2.05 1.83 0.86 0.99 1.94
Professional
and business
trips, million 0.54 0.52 0.58 0.49 0.59 0.50 0.40 0.57 0.28 0.30 0.52
Tourists’
expenditure, €
billion 6.48 7.75 8.58 7.85 8.89 13.07 14.11 13.56 4.31 11.12 16.18
Personal
reasons tourists’
expenditure, €
billion 6.18 7.44 8.20 7.59 8.58 12.74 13.82 13.19 4.14 10.88 15.69
Professional
and business
tourists’
expenditure, €
billion 0.30 0.30 0.38 0.27 0.31 0.33 0.29 0.38 0.18 0.25 0.49
28