
Page 56 - Azerbaijan State University of Economics
P. 56
Vugar Rahimov: Relationship between PPI and CPI in Azerbaijan: A Wavelet Approach
On the other hand, the producer price index is divided into four broad categories: (i)
industrial producer price indices; (ii) agricultural, fishery and forestry products; (iii)
producer price indices of transport, warehouse, postal, communication, information
and communication technologies and advertising services; and (iv) producer index in
construction and installation works. As per the SSCRA, “producer price does not
include value-added, excise etc. taxes and transportation costs not related to the cost
3
of the product” .
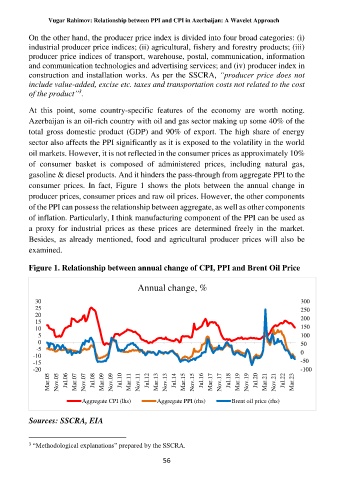
At this point, some country-specific features of the economy are worth noting.
Azerbaijan is an oil-rich country with oil and gas sector making up some 40% of the
total gross domestic product (GDP) and 90% of export. The high share of energy
sector also affects the PPI significantly as it is exposed to the volatility in the world
oil markets. However, it is not reflected in the consumer prices as approximately 10%
of consumer basket is composed of administered prices, including natural gas,
gasoline & diesel products. And it hinders the pass-through from aggregate PPI to the
consumer prices. In fact, Figure 1 shows the plots between the annual change in
producer prices, consumer prices and raw oil prices. However, the other components
of the PPI can possess the relationship between aggregate, as well as other components
of inflation. Particularly, I think manufacturing component of the PPI can be used as
a proxy for industrial prices as these prices are determined freely in the market.
Besides, as already mentioned, food and agricultural producer prices will also be
examined.
Figure 1. Relationship between annual change of CPI, PPI and Brent Oil Price
Annual change, %
30 300
25 250
20 200
15
10 150
5 100
0 50
-5
-10 0
-15 -50
-20 -100
Mar.05 Nov.05 Jul.06 Mar.07 Nov.07 Jul.08 Mar.09 Nov.09 Jul.10 Mar.11 Nov.11 Jul.12 Mar.13 Nov.13 Jul.14 Mar.15 Nov.15 Jul.16 Mar.17 Nov.17 Jul.18 Mar.19 Nov.19 Jul.20 Mar.21 Nov.21 Jul.22 Mar.23
Aggregate CPI (lhs) Aggregate PPI (rhs) Brent oil price (rhs)
Sources: SSCRA, EIA
3 “Methodological explanations” prepared by the SSCRA.
56