
Page 73 - Azerbaijan State University of Economics
P. 73
Murad Yusifov: Modelling the inflationary processes and forecasting:an application of ARIMA,
SARIMA models
Table.2. Results of SARIMA(2,0,2)(1,0,0)x12.
Variable Coefficients Std. error Prob.
C 100.0933 0.278618 0
AR(1) 1.012855 0.284939 0.0008
AR(2) -0.51392 0.224334 0.0261
SAR(12) 0.566002 0.118397 0
MA(1) -0.77715 0.300845 0.0126
MA(2) 0.54498 0.197902 0.0081
The estimated SARIMA(1,0,1)(0,0,1)x12 model are as follows.
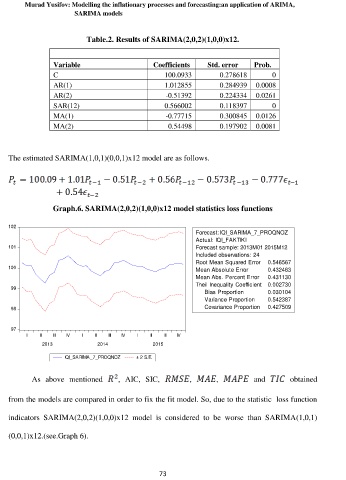
Graph.6. SARIMA(2,0,2)(1,0,0)x12 model statistics loss functions
102
Forecast: IQI_SARIMA_7_PROQNOZ
Actual: IQI_FAKTIKI
101 Forecast sample: 2013M01 2015M12
Included observations: 24
Root Mean Squared Error 0.546567
100 Mean Absolute Error 0.432463
Mean Abs. Percent Error 0.431130
Theil Inequality Coefficient 0.002730
99
Bias Proportion 0.030104
Variance Proportion 0.542387
98 Covariance Proportion 0.427509
97
I II III IV I II III IV I II III IV
2013 2014 2015
IQI_SARIMA_7_PROQNOZ ± 2 S.E.
As above mentioned , AIC, SIC, , , and obtained
from the models are compared in order to fix the fit model. So, due to the statistic loss function
indicators SARIMA(2,0,2)(1,0,0)x12 model is considered to be worse than SARIMA(1,0,1)
(0,0,1)x12.(see.Graph 6).
73