
Page 75 - Azerbaijan State University of Economics
P. 75
Murad Yusifov: Modelling the inflationary processes and forecasting:an application of ARIMA,
SARIMA models
0.005700 0.9400 0.613619 0.4364 0.002944 0.9569
Heteroskedasticity
Test: White
0.795490 0.6697 0.747056 0.7972 2.527891 0.4684
Normality test 0,3129 0,1102 0,426
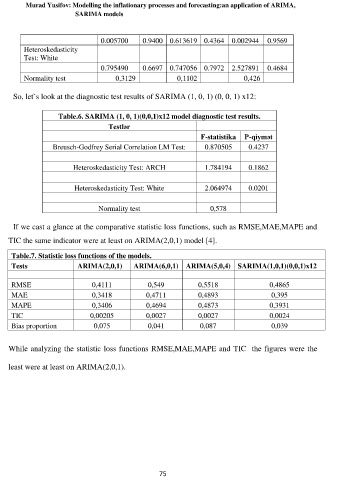
So, let`s look at the diagnostic test results of SARIMA (1, 0, 1) (0, 0, 1) x12:
Table.6. SARIMA (1, 0, 1)(0,0,1)x12 model diagnostic test results.
Testlər
F-statistika P-qiymət
Breusch-Godfrey Serial Correlation LM Test: 0.870505 0.4237
Heteroskedasticity Test: ARCH 1.784194 0.1862
Heteroskedasticity Test: White 2.064974 0.0201
Normality test 0,578
If we cast a glance at the comparative statistic loss functions, such as RMSE,MAE,MAPE and
TIC the same indicator were at least on ARIMA(2,0,1) model [4].
Table.7. Statistic loss functions of the models.
Tests ARIMA(2,0,1) ARIMA(6,0,1) ARIMA(5,0,4) SARIMA(1,0,1)(0,0,1)x12
RMSE 0,4111 0,549 0,5518 0,4865
MAE 0,3418 0,4711 0,4893 0,395
MAPE 0,3406 0,4694 0,4873 0,3931
TIC 0,00205 0,0027 0,0027 0,0024
Bias proportion 0,075 0,041 0,087 0,039
While analyzing the statistic loss functions RMSE,MAE,MAPE and TIC the figures were the
least were at least on ARIMA(2,0,1).
75