
Page 76 - Azerbaijan State University of Economics
P. 76
THE JOURNAL OF ECONOMIC SCIENCES: THEORY AND PRACTICE, V.71, # 2, 2014, pp. 66-80
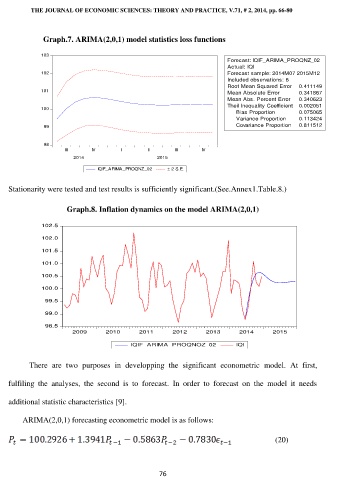
Graph.7. ARIMA(2,0,1) model statistics loss functions
103
Forecast: IQIF_ARIMA_PROQNZ_02
Actual: IQI
102 Forecast sample: 2014M07 2015M12
Included observations: 6
Root Mean Squared Error 0.411149
101 Mean Absolute Error 0.341867
Mean Abs. Percent Error 0.340623
Theil Inequality Coefficient 0.002051
100
Bias Proportion 0.075065
Variance Proportion 0.113424
99 Covariance Proportion 0.811512
98
III IV I II III IV
2014 2015
IQIF_ARIMA_PROQNZ_02 ± 2 S.E.
Stationarity were tested and test results is sufficiently significant.(See.Annex1.Table.8.)
Graph.8. Inflation dynamics on the model ARIMA(2,0,1)
102.5
102.0
101.5
101.0
100.5
100.0
99.5
99.0
98.5
2009 2010 2011 2012 2013 2014 2015
IQIF_ARIMA_PROQNOZ_02 IQI
There are two purposes in developping the significant econometric model. At first,
fulfiling the analyses, the second is to forecast. In order to forecast on the model it needs
additional statistic characteristics [9].
ARIMA(2,0,1) forecasting econometric model is as follows:
(20)
76