
Page 11 - Azerbaijan State University of Economics
P. 11
Shaikh A. Hamid, Tej S. Dhakar: Anamolous Behavior of the Volatility of Nasdaq
Composite Index: 1971 To 2017
Note: “Positive” implies the mean of monthly changes was significantly greater than
zero “Higher” implies the mean of absolute percent changes or the variance of
absolute percent changes for a month was significantly higher than those of the other
eleven months stacked; “Lower” implies the mean or the variance of absolute percent
changes for a month was significantly lower than those of the other eleven months
stacked. Numbers are rounded in all tables to two decimal places.
The standard deviation of absolute percent changes of October and April are
separately highly significantly higher than the standard deviations of the absolute
percent changes of the other eleven months stacked (p=0.00). The standard deviation
of absolute percent changes of February and June are separately highly significantly
lower than the standard deviations of the absolute percent changes of the other eleven
months stacked (p=0.01 and 0.00 respectively based on F-test). So we do not find
seasonality in terms of mean of absolute percent changes, but we find seasonality in
terms of variance of the absolute percent changes.
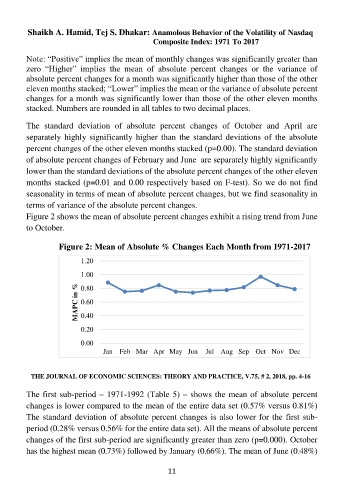
Figure 2 shows the mean of absolute percent changes exhibit a rising trend from June
to October.
Figure 2: Mean of Absolute % Changes Each Month from 1971-2017
1.20
1.00
MAPC in % 0.60
0.80
0.40
0.20
0.00
Jan Feb Mar Apr May Jun Jul Aug Sep Oct Nov Dec
THE JOURNAL OF ECONOMIC SCIENCES: THEORY AND PRACTICE, V.75, # 2, 2018, pp. 4-16
The first sub-period – 1971-1992 (Table 5) – shows the mean of absolute percent
changes is lower compared to the mean of the entire data set (0.57% versus 0.81%)
The standard deviation of absolute percent changes is also lower for the first sub-
period (0.28% versus 0.56% for the entire data set). All the means of absolute percent
changes of the first sub-period are significantly greater than zero (p=0.000). October
has the highest mean (0.73%) followed by January (0.66%). The mean of June (0.48%)
11