
Page 13 - Azerbaijan State University of Economics
P. 13
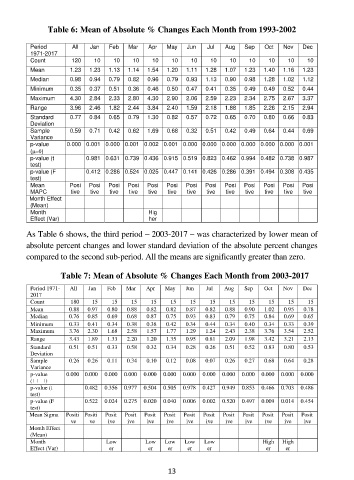
Table 6: Mean of Absolute % Changes Each Month from 1993-2002
Period All Jan Feb Mar Apr May Jun Jul Aug Sep Oct Nov Dec
1971-2017
Count 120 10 10 10 10 10 10 10 10 10 10 10 10
Mean 1.23 1.23 1.13 1.14 1.54 1.20 1.11 1.28 1.07 1.23 1.40 1.16 1.23
Median 0.98 0.94 0.79 0.82 0.96 0.79 0.93 1.13 0.90 0.98 1.28 1.02 1.12
Minimum 0.35 0.37 0.51 0.36 0.46 0.50 0.47 0.41 0.35 0.49 0.49 0.52 0.44
Maximum 4.30 2.84 2.33 2.80 4.30 2.90 2.06 2.59 2.23 2.34 2.75 2.67 3.37
Range 3.96 2.46 1.82 2.44 3.84 2.40 1.59 2.18 1.88 1.85 2.26 2.15 2.94
Standard 0.77 0.84 0.65 0.79 1.30 0.82 0.57 0.72 0.65 0.70 0.80 0.66 0.83
Deviation
Sample 0.59 0.71 0.42 0.62 1.69 0.68 0.32 0.51 0.42 0.49 0.64 0.44 0.69
Variance
p-value 0.000 0.001 0.000 0.001 0.002 0.001 0.000 0.000 0.000 0.000 0.000 0.000 0.001
()
p-value (t 0.981 0.631 0.739 0.436 0.915 0.519 0.823 0.462 0.994 0.482 0.738 0.987
test)
p-value (F 0.412 0.286 0.524 0.025 0.447 0.141 0.426 0.286 0.391 0.494 0.308 0.435
test)
Mean Posi Posi Posi Posi Posi Posi Posi Posi Posi Posi Posi Posi Posi
MAPC tive tive tive tive tive tive tive tive tive tive tive tive tive
Month Effect
(Mean)
Month Hig
Effect (Var) her
As Table 6 shows, the third period – 2003-2017 – was characterized by lower mean of
absolute percent changes and lower standard deviation of the absolute percent changes
compared to the second sub-period. All the means are significantly greater than zero.
Table 7: Mean of Absolute % Changes Each Month from 2003-2017
Period 1971- All Jan Feb Mar Apr May Jun Jul Aug Sep Oct Nov Dec
2017
Count 180 15 15 15 15 15 15 15 15 15 15 15 15
Mean 0.88 0.97 0.80 0.88 0.82 0.82 0.87 0.82 0.88 0.90 1.02 0.95 0.78
Median 0.76 0.85 0.69 0.68 0.87 0.75 0.93 0.83 0.79 0.75 0.84 0.69 0.65
Minimum 0.33 0.41 0.34 0.38 0.38 0.42 0.34 0.44 0.34 0.40 0.34 0.33 0.39
Maximum 3.76 2.30 1.68 2.58 1.57 1.77 1.29 1.24 2.43 2.38 3.76 3.54 2.52
Range 3.43 1.89 1.33 2.20 1.20 1.35 0.95 0.81 2.09 1.98 3.42 3.21 2.13
Standard 0.51 0.51 0.33 0.58 0.32 0.34 0.28 0.26 0.51 0.52 0.83 0.80 0.53
Deviation
Sample 0.26 0.26 0.11 0.34 0.10 0.12 0.08 0.07 0.26 0.27 0.68 0.64 0.28
Variance
p-value 0.000 0.000 0.000 0.000 0.000 0.000 0.000 0.000 0.000 0.000 0.000 0.000 0.000
( )
p-value (t 0.482 0.356 0.977 0.504 0.505 0.978 0.427 0.949 0.853 0.466 0.703 0.486
test)
p-value (F 0.522 0.024 0.275 0.020 0.040 0.006 0.002 0.520 0.497 0.009 0.014 0.454
test)
Mean Sigma Positi Positi Posit Posit Posit Posit Posit Posit Posit Posit Posit Posit Posit
ve ve ive ive ive ive ive ive ive ive ive ive ive
Month Effect
(Mean)
Month Low Low Low Low Low High High
Effect (Var) er er er er er er er
13