
Page 14 - Azerbaijan State University of Economics
P. 14
THE JOURNAL OF ECONOMIC SCIENCES: THEORY AND PRACTICE, V.75, # 2, 2018, pp. 4-16
The mean of percent changes of October is the highest (1.02%) followed by November
(0.95%) and the standard deviations of the two months are also among the highest (0.83%
and 0.80% respectively). The third sub-period does not present seasonality in terms of
mean; the mean of absolute percent changes of none of the months is significantly greater
than that of the other eleven months stacked. But there is seasonality in terms of variance.
The standard deviations of the percent changes of October and November are separately
significantly higher than the standard deviations of the percent changes of other eleven
months stacked. The standard deviations of February, and April through July, are
significantly lower. This sub-period includes the Great Recession (spanning months of
2008-2009) and the longest period of steady economic growth thereafter, hence a lower
variance compared to the previous sub-period.
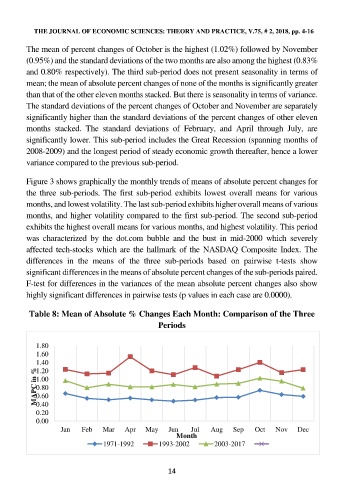
Figure 3 shows graphically the monthly trends of means of absolute percent changes for
the three sub-periods. The first sub-period exhibits lowest overall means for various
months, and lowest volatility. The last sub-period exhibits higher overall means of various
months, and higher volatility compared to the first sub-period. The second sub-period
exhibits the highest overall means for various months, and highest volatility. This period
was characterized by the dot.com bubble and the bust in mid-2000 which severely
affected tech-stocks which are the hallmark of the NASDAQ Composite Index. The
differences in the means of the three sub-periods based on pairwise t-tests show
significant differences in the means of absolute percent changes of the sub-periods paired.
F-test for differences in the variances of the mean absolute percent changes also show
highly significant differences in pairwise tests (p values in each case are 0.0000).
Table 8: Mean of Absolute % Changes Each Month: Comparison of the Three
Periods
1.80
1.60
1.40
1.20
MAPC in % 1.00
0.80
0.60
0.40
0.20
0.00
Jan Feb Mar Apr May Jun Jul Aug Sep Oct Nov Dec
Month
1971-1992 1993-2002 2003-2017
14