Page 45 - Azerbaijan State University of Economics
P. 45

THE JOURNAL OF ECONOMIC SCIENCES: THEORY AND PRACTICE, V.76, # 2, 2019, pp. 31-45


                                                                                     6,000
                                                                                     5,000
                                                                                     4,000
                                                                                     3,000
                    6,000                                                            2,000
                    4,000                                                            1,000
                                                                                     0
                    2,000
                        0
                    -2,000
                    -4,000
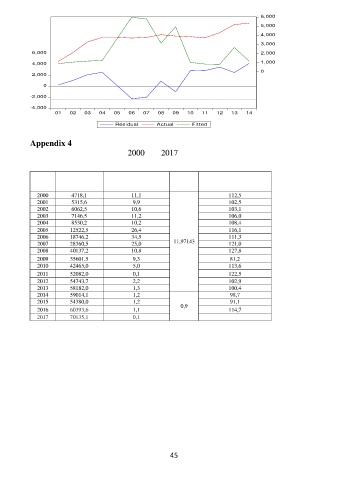
                           01  02  03  04  05   06  07  08  09  10  11   12  13  14
                                            Residual    Actual    Fitted

                    Appendix 4
                    GDP of Azerbaijan between 2000 and 2017 and dynamics of indicators
                    characterizing its growth

                                         GDP growth in               Deflator of GDP in
                            GDP   (million   percentage in comparison   Average   percentage in comparison
                     Years   manats)     with the previous year   Growth   with the previous year
                      2000     4718,1           11,1                        112,5
                      2001     5315,6            9,9                        102,5
                      2002     6062,5           10,6                        103,1
                      2003     7146,5           11,2                        106,0
                      2004     8530,2           10,2                        108,4
                      2005     12522,5          26,4                        116,1
                      2006     18746,2          34,5                        111,3
                      2007     28360,5          25,0        11,97143        121,0
                      2008     40137,2          10,8                        127,8
                      2009     35601,5           9,3                        81,2
                      2010     42465,0           5,0                        113,6
                      2011     52082,0           0,1                        122,5
                      2012     54743,7           2,2                        102,9
                      2013     58182,0           1,3                        100,4
                      2014     59014,1           1,2                        98,7
                      2015     54380,0           1,2                        91,1
                      2016     60393,6           1,1          0,9           114,7
                      2017     70135,1           0,1


                                                           45
   40   41   42   43   44   45   46   47   48   49   50