
Page 12 - Azerbaijan State University of Economics
P. 12
THE JOURNAL OF ECONOMIC SCIENCES: THEORY AND PRACTICE, V.77, # 2, 2020, pp. 4-39
number from the study population and its number reached (308) employees and
employees of the Authority. Aqaba Special Economic Zone. The questionnaires
were distributed over all the sample items, so (265) questionnaires were retrieved
(86%) of the study sample size, and (19) questionnaires were excluded because they
were not suitable for statistical analysis, and thus the number of questionnaires valid
for analysis became (246) questionnaires, forming (80%)) Of the study sample,
which is a valid percentage for scientific research purposes, and Table (1) shows the
distribution of the study sample.
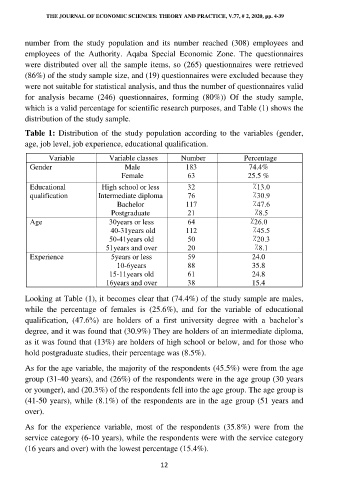
Table 1: Distribution of the study population according to the variables (gender,
age, job level, job experience, educational qualification.
Variable Variable classes Number Percentage
Gender Male 183 74.4%
Female 63 25.5 %
Educational High school or less 32 ٪ 13.0
qualification Intermediate diploma 76 ٪ 30.9
Bachelor 117 ٪ 47.6
Postgraduate 21 ٪ 8.5
Age 30years or less 64 ٪ 26.0
40 - 31years old 112 ٪ 45.5
50 - 41years old 50 ٪ 20.3
51years and over 20 ٪ 8.1
Experience 5 years or less 59 24.0
10 6 - years 88 35.8
15 - 11years old 61 24.8
16years and over 38 15.4
Looking at Table (1), it becomes clear that (74.4%) of the study sample are males,
while the percentage of females is (25.6%), and for the variable of educational
qualification, (47.6%) are holders of a first university degree with a bachelor’s
degree, and it was found that (30.9%) They are holders of an intermediate diploma,
as it was found that (13%) are holders of high school or below, and for those who
hold postgraduate studies, their percentage was (8.5%).
As for the age variable, the majority of the respondents (45.5%) were from the age
group (31-40 years), and (26%) of the respondents were in the age group (30 years
or younger), and (20.3%) of the respondents fell into the age group. The age group is
(41-50 years), while (8.1%) of the respondents are in the age group (51 years and
over).
As for the experience variable, most of the respondents (35.8%) were from the
service category (6-10 years), while the respondents were with the service category
(16 years and over) with the lowest percentage (15.4%).
12