
Page 8 - Azerbaijan State University of Economics
P. 8
THE JOURNAL OF ECONOMIC SCIENCES: THEORY AND PRACTICE, V.78, # 2, 2021, pp. 4-16
x n + x n
x = 1 1 2 2
n + n 2
1
2
2
2
2
( + ̅̅̅ ) + ( + ̅̅̅ )
2
2
= 1 1 1 2 2 2 − ̅
+ 2
1
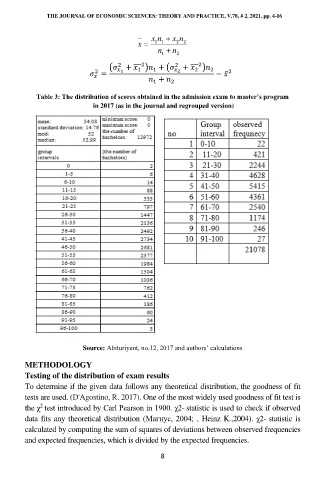
Table 3: The distribution of scores obtained in the admission exam to master’s program
in 2017 (as in the journal and regrouped version)
Source: Abituriyent, no.12, 2017 and authors’ calculations
METHODOLOGY
Testing of the distribution of exam results
To determine if the given data follows any theoretical distribution, the goodness of fit
tests are used. (D'Agostino, R. 2017). One of the most widely used goodness of fit test is
2
the χ test introduced by Carl Pearson in 1900. χ2- statistic is used to check if observed
data fits any theoretical distribution (Магнус, 2004; , Heinz K.,2004). χ2- statistic is
calculated by computing the sum of squares of deviations between observed frequencies
and expected frequencies, which is divided by the expected frequencies.
8