
Page 99 - Azerbaijan State University of Economics
P. 99
THE JOURNAL OF ECONOMIC SCIENCES: THEORY AND PRACTICE, V.78, # 2, 2021, pp. 89-104
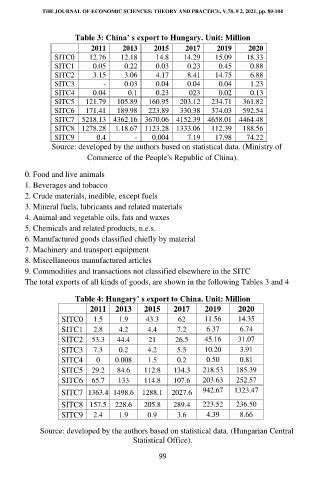
Table 3: China’ s export to Hungary. Unit: Million
2011 2013 2015 2017 2019 2020
SITC0 12.76 12.18 14.8 14.29 15.09 18.33
SITC1 0.05 0.22 0.03 0.23 0.45 0.88
SITC2 3.15 3.06 4.17 8.41 14.75 6.88
SITC3 - 0.03 0.04 0.04 0.04 1.23
SITC4 0.04 0.1 0.23 023 0.02 0.13
SITC5 121.79 105.89 160.95 203.12 234.71 361.82
SITC6 171.41 189.98 223.89 330.38 374.03 592.54
SITC7 5218.13 4362.16 3670.06 4152.39 4658.01 4464.48
SITC8 1278.28 1.18.67 1123.28 1333.06 112.39 188.56
SITC9 0.4 - 0.004 7.19 17.98 74.22
Source: developed by the authors based on statistical data. (Ministry of
Commerce of the People's Republic of China).
0. Food and live animals
1. Beverages and tobacco
2. Crude materials, inedible, except fuels
3. Mineral fuels, lubricants and related materials
4. Animal and vegetable oils, fats and waxes
5. Chemicals and related products, n.e.s.
6. Manufactured goods classified chiefly by material
7. Machinery and transport equipment
8. Miscellaneous manufactured articles
9. Commodities and transactions not classified elsewhere in the SITC
The total exports of all kinds of goods, are shown in the following Tables 3 and 4
Table 4: Hungary’ s export to China. Unit: Million
2011 2013 2015 2017 2019 2020
SITC0 1.5 1.9 43.3 62 11.56 14.35
SITC1 2.8 4.2 4.4 7.2 6.37 6.74
SITC2 53.3 44.4 21 26.5 45.16 31.07
SITC3 7.3 0.2 4.2 5.5 10.20 3.91
SITC4 0 0.008 1.5 0.2 0.50 0.81
SITC5 29.2 84.6 112.8 134.3 218.53 185.39
SITC6 65.7 133 114.8 107.6 203.63 252.57
SITC7 1363.4 1498.6 1288.1 2027.6 942.67 1323.47
SITC8 157.5 228.6 205.8 289.4 223.52 236.50
SITC9 2.4 1.9 0.9 3.6 4.39 8.66
Source: developed by the authors based on statistical data. (Hungarian Central
Statistical Office).
99