
Page 69 - Azerbaijan State University of Economics
P. 69
THE JOURNAL OF ECONOMIC SCIENCES: THEORY AND PRACTICE, V.81, # 1, 2024, pp. 65-75
As for the distribution of direct foreign investments by region in 2020-2023, Tbilisi
leads with 81%. Only 6% of the total volume of investments was made in Kvemo
Kartli and Adjara, and 2% - in Shida Kartli, Samegrelo-Zemo Svaneti and Mtskheta-
Mtianeti.
In Racha-Lechkhumi and Kvemo Svaneti, Guria and Kakheti, foreign direct
investments are almost not carried out. Unfortunately, the largest part of direct foreign
investments is carried out only in the capital, while the development of the rest of the
regions is not observed in this regard.
As for foreign direct investments by the sectors of the largest economy in 2020-2023,
financial and insurance activities lead with a total of 36%, followed by processing
industry with 11%. The volume of foreign direct investments in the sectors of
education, health and social services, professional, scientific and technical activities
is very small and makes up only 4% of the total. The volume of direct foreign
investments in real estate-related activities in 2020-2023 is 9%.
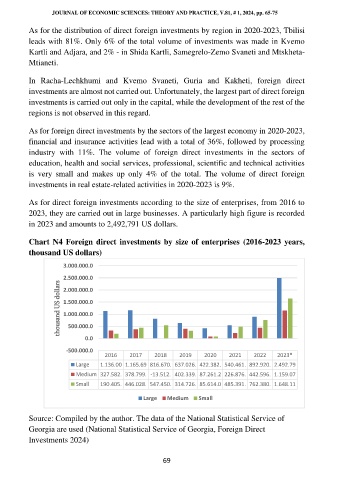
As for direct foreign investments according to the size of enterprises, from 2016 to
2023, they are carried out in large businesses. A particularly high figure is recorded
in 2023 and amounts to 2,492,791 US dollars.
Chart N4 Foreign direct investments by size of enterprises (2016-2023 years,
thousand US dollars)
3.000.000.0
2.500.000.0
thousand US dollars 1.500.000.0
2.000.000.0
1.000.000.0
500.000.0
0.0
-500.000.0
2016 2017 2018 2019 2020 2021 2022 2023*
Large 1.136.00 1.165.69 816.670. 637.026. 422.382. 540.461. 892.920. 2.492.79
Medium 327.582. 378.799. -13.512. 402.339. 87.261.2 226.876. 442.596. 1.159.07
Small 190.405. 446.028. 547.450. 314.726. 85.614.0 485.391. 762.380. 1.648.11
Large Medium Small
Source: Compiled by the author. The data of the National Statistical Service of
Georgia are used (National Statistical Service of Georgia, Foreign Direct
Investments 2024)
69