
Page 10 - Azerbaijan State University of Economics
P. 10
THE JOURNAL OF ECONOMIC SCIENCES: THEORY AND PRACTICE, V.81, # 2, 2024, pp. 4-29
• Scenario analysis: Internal and external loss databases focus on what has already
happened, while scenario analysis contributes to suggesting what may happen, even if it
has not happened before, and then it should be intended not only to supplement existing
internal data when estimating the impact of potentially rare but highly impactful events,
but also to represent an ongoing exercise to anticipate potential new risks that may result
from changes in the external environment as well as from internal changes. (Saita, 2007).
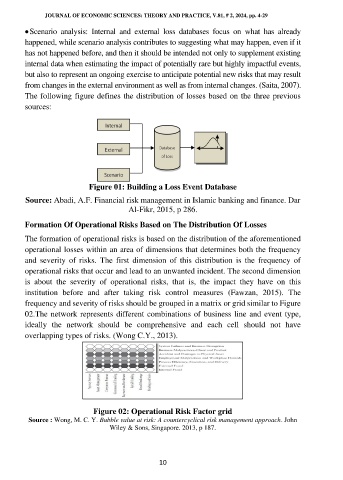
The following figure defines the distribution of losses based on the three previous
sources:
Figure 01: Building a Loss Event Database
Source: Abadi, A.F. Financial risk management in Islamic banking and finance. Dar
Al-Fikr, 2015, p 286.
Formation Of Operational Risks Based on The Distribution Of Losses
The formation of operational risks is based on the distribution of the aforementioned
operational losses within an area of dimensions that determines both the frequency
and severity of risks. The first dimension of this distribution is the frequency of
operational risks that occur and lead to an unwanted incident. The second dimension
is about the severity of operational risks, that is, the impact they have on this
institution before and after taking risk control measures (Fawzan, 2015). The
frequency and severity of risks should be grouped in a matrix or grid similar to Figure
02.The network represents different combinations of business line and event type,
ideally the network should be comprehensive and each cell should not have
overlapping types of risks. (Wong C.Y., 2013).
Figure 02: Operational Risk Factor grid
Source : Wong, M. C. Y. Bubble value at risk: A countercyclical risk management approach. John
Wiley & Sons, Singapore. 2013, p 187.
10