
Page 15 - Azerbaijan State University of Economics
P. 15
Aimene Farid, Bahi Nawel:Operational Risk Estimation Using the Value-at-Risk (VAR)
Method: Case Study of the External Bank of Algeria (EBA)
Formation of Operational Risks Based on The Distribution of Losses
We mentioned earlier that not all risk factors need to be quantitatively modeled, but only
those that belong to expected and unexpected losses. These factors must be divided into
four partial spaces according to the area map of operational risks (see Figure 03).
Therefore, in order to form the operational risks that must be quantitatively modeled, we
first need to challenge the frequency and value of loss for each risk factor:
Determining The Frequency And Value of Loss For The Event of Computer Failure
The following table shows the frequency and loss value of the computer failure event
for the period 2012-2020:
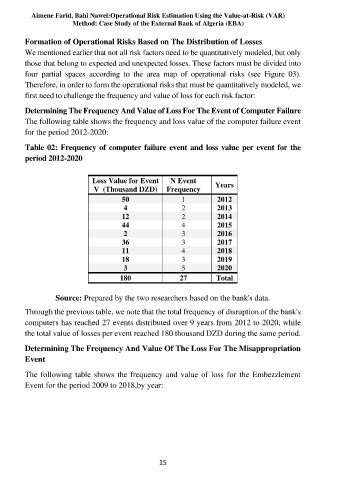
Table 02: Frequency of computer failure event and loss value per event for the
period 2012-2020
Loss Value for Event N Event Years
V (Thousand DZD) Frequency
50 1 2012
4 2 2013
12 2 2014
44 4 2015
2 3 2016
36 3 2017
11 4 2018
18 3 2019
3 5 2020
180 27 Total
Source: Prepared by the two researchers based on the bank's data.
Through the previous table, we note that the total frequency of disruption of the bank's
computers has reached 27 events distributed over 9 years from 2012 to 2020, while
the total value of losses per event reached 180 thousand DZD during the same period.
Determining The Frequency And Value Of The Loss For The Misappropriation
Event
The following table shows the frequency and value of loss for the Embezzlement
Event for the period 2009 to 2018,by year:
15