
Page 44 - Azerbaijan State University of Economics
P. 44
THE JOURNAL OF ECONOMIC SCIENCES: THEORY AND PRACTICE, V.82, # 1, 2025, pp. 36-51
This expansion was driven by the adoption of technological innovations from Western
countries, which represent key intensive factors of economic growth in the oil sector.
Initially, drilling in the Caspian Sea reached depths of 500 meters—exceeding the
Soviet-era limit of 150 meters—and current capabilities now extend to 1,000 meters.
Amid this period of economic growth, Azerbaijan faced pressures from major powers,
notably the United States, which advocated for an oil export pipeline route through
Armenian territory. Nevertheless, Azerbaijan’s resolute position facilitated the
construction of the Baku-Tbilisi-Kars pipeline, which avoids the Republic of Armenia
by traversing Georgia. This pipeline commenced operations on June 13, 2006.
Complementing this, the Baku-Tbilisi-Ceyhan (BTC) main export pipeline transports
crude oil from the Azeri-Chirag-Gunashli and Shah Deniz fields in the Azerbaijani
sector of the Caspian Sea to the Ceyhan port in Turkey, enabling onward distribution
to European markets via the Mediterranean Sea. Since its inception, the BTC pipeline
has also facilitated the transit of crude oil from Turkmenistan, and, as of October 2013,
BTC Co. has expanded its operations to include a portion of the crude oil extracted
from Kazakhstan’s Tengiz field. This infrastructure continues to underpin
Azerbaijan’s integration into European markets and its cooperation with European
nations. Additionally, the South Caucasus Pipeline plays a vital role in bolstering the
country’s economic growth.
39.68
37.09
34.88
31.12
29.37 27.82
26.29
25.31
22.43
19.62 20.48
15.28
13.20
3.66
1993 1994 1995 1996 1997 1998 1999 2000 2001 2002 2003 2004 2005 2006 2007 2008 2009 2010 2011 2012 2013 2014 2015 2016 2017 2018 2019 2020
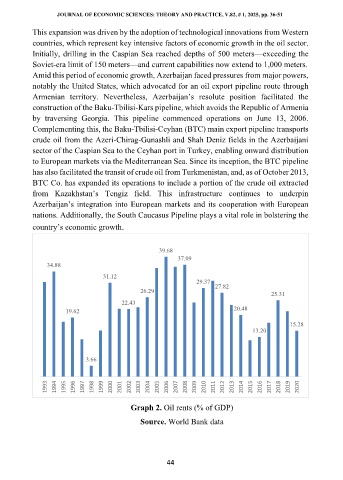
Graph 2. Oil rents (% of GDP)
Source. World Bank data
44