Page 31 - Azerbaijan State University of Economics
P. 31

THE JOURNAL OF ECONOMIC SCIENCES: THEORY AND PRACTICE, V.73, # 2, 2016, pp. 27-41


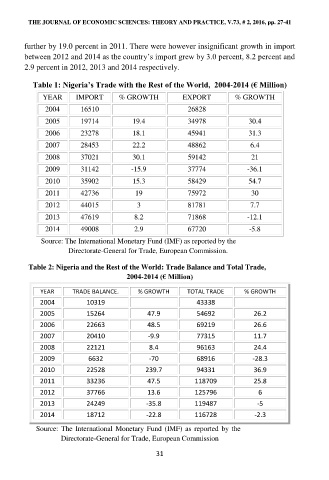
                    further by 19.0 percent in 2011. There were however insignificant growth in import
                    between 2012 and 2014 as the country‟s import grew by 3.0 percent, 8.2 percent and
                    2.9 percent in 2012, 2013 and 2014 respectively.

                      Table 1: Nigeria’s Trade with the Rest of the World,  2004-2014 (€ Million)

                         YEAR      IMPORT       % GROWTH           EXPORT          % GROWTH
                          2004       16510                           26828
                          2005       19714          19.4             34978             30.4
                          2006       23278          18.1             45941             31.3
                          2007       28453          22.2             48862              6.4

                          2008       37021          30.1             59142              21
                          2009       31142          -15.9            37774             -36.1
                          2010       35902          15.3             58429             54.7

                          2011       42736           19              75972              30
                          2012       44015            3              81781              7.7
                          2013       47619           8.2             71868             -12.1
                          2014       49008           2.9             67720             -5.8

                              Source: The International Monetary Fund (IMF) as reported by the
                                            Directorate-General for Trade, European Commission.


                     Table 2: Nigeria and the Rest of the World: Trade Balance and Total Trade,
                                                   2004-2014 (€ Million)

                         YEAR     TRADE BALANCE.      % GROWTH       TOTAL TRADE      % GROWTH
                        2004          10319                             43338
                        2005          15264              47.9           54692            26.2
                        2006          22663              48.5           69219            26.6

                        2007          20410              -9.9           77315            11.7
                        2008          22121              8.4            96163            24.4
                        2009           6632              -70            68916            -28.3
                        2010          22528             239.7           94331            36.9
                        2011          33236              47.5          118709            25.8
                        2012          37766              13.6          125796             6
                        2013          24249             -35.8          119487             -5

                        2014          18712             -22.8          116728            -2.3
                           Source: The International Monetary Fund (IMF) as reported by the
                                        Directorate-General for Trade, European Commission

                                                           31
   26   27   28   29   30   31   32   33   34   35   36