
Page 112 - Azerbaijan State University of Economics
P. 112
THE JOURNAL OF ECONOMIC SCIENCES: THEORY AND PRACTICE, V.81, # 2, 2024, pp. 104-116
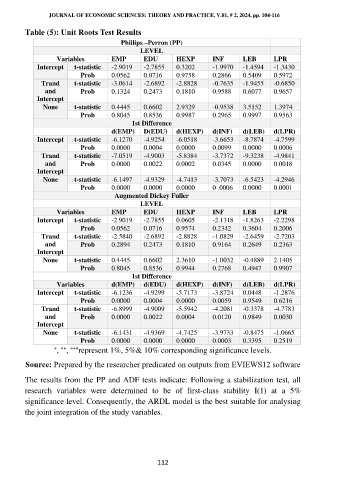
Table (5): Unit Roots Test Results
Phillips –Perron (PP)
LEVEL
Variables EMP EDU HEXP INF LEB LPR
Intercept t-statistic -2.9019 -2.7855 0.3202 -1.9970 -1.4594 -1.3430
Prob 0.0562 0.0716 0.9758 0.2866 0.5409 0.5972
Trand t-statistic -3.0614 -2.6892 -2.8828 -0.7635 -1.9455 -0.6850
and Prob 0.1324 0.2473 0.1810 0.9588 0.6077 0.9657
Intercept
None t-statistic 0.4445 0.6602 2.9329 -0.9538 3.5152 1.3974
Prob 0.8045 0.8536 0.9987 0.2965 0.9997 0.9563
1st Difference
d(EMP) D(EDU) d(HEXP) d(INF) d(LEB) d(LPR)
Intercept t-statistic -6.1270 -4.9254 -6.0518 -3.6653 -8.7874 -4.7599
Prob 0.0000 0.0004 0.0000 0.0099 0.0000 0.0006
Trand t-statistic -7.0519 -4.9003 -5.8384 -3.7372 -9.3238 -4.9841
and Prob 0.0000 0.0022 0.0002 0.0345 0.0000 0.0018
Intercept
None t-statistic -6.1497 -4.9329 -4.7413 -3.7073 -6.5423 -4.2946
Prob 0.0000 0.0000 0.0000 0 .0006 0.0000 0.0001
Augmented Dickey Fuller
LEVEL
Variables EMP EDU HEXP INF LEB LPR
Intercept t-statistic -2.9019 -2.7855 0.0605 -2.1318 -1.8263 -2.2298
Prob 0.0562 0.0716 0.9574 0.2342 0.3604 0.2006
Trand t-statistic -2.5840 -2.6892 -2.8828 -1.0829 -2.6459 -2.7203
and Prob 0.2894 0.2473 0.1810 0.9164 0.2649 0.2363
Intercept
None t-statistic 0.4445 0.6602 2.3610 -1.0032 -0.4889 2.1405
Prob 0.8045 0.8536 0.9944 0.2768 0.4947 0.9907
1st Difference
Variables d(EMP) d(EDU) d(HEXP) d(INF) d(LEB) d(LPR)
Intercept t-statistic -6.1236 -4.9299 -5.7173 -3.8724 0.0448 -1.2876
Prob 0.0000 0.0004 0.0000 0.0059 0.9549 0.6216
Trand t-statistic -6.8999 -4.9009 -5.5942 -4.2081 -0.3378 -4.7783
and Prob 0.0000 0.0022 0.0004 0.0120 0.9849 0.0030
Intercept
None t-statistic -6.1431 -4.9369 -4.7425 -3.9733 -0.8475 -1.0665
Prob 0.0000 0.0000 0.0000 0.0003 0.3395 0.2519
represent 1%, 5%& 10% corresponding significance levels.
, ,
Source: Prepared by the researcher predicated on outputs from EVIEWS12 software
The results from the PP and ADF tests indicate : Following a stabilization test, all
research variables were determined to be of first-class stability I(1) at a 5%
significance level. Consequently, the ARDL model is the best suitable for analysing
the joint integration of the study variables.
112