
Page 62 - Azerbaijan State University of Economics
P. 62
THE JOURNAL OF ECONOMIC SCIENCES: THEORY AND PRACTICE, V.82, # 1, 2025, pp. 52-69
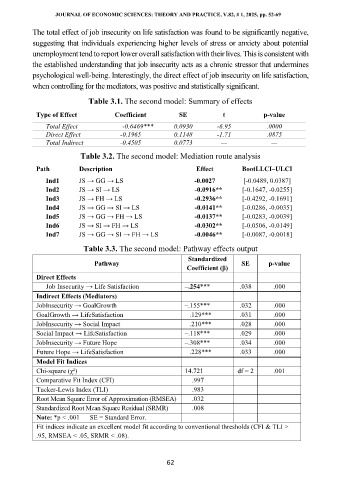
The total effect of job insecurity on life satisfaction was found to be significantly negative,
suggesting that individuals experiencing higher levels of stress or anxiety about potential
unemployment tend to report lower overall satisfaction with their lives. This is consistent with
the established understanding that job insecurity acts as a chronic stressor that undermines
psychological well-being. Interestingly, the direct effect of job insecurity on life satisfaction,
when controlling for the mediators, was positive and statistically significant.
Table 3.1. The second model: Summary of effects
Type of Effect Coefficient SE t p-value
Total Effect -0.6469*** 0.0930 -6.95 .0000
Direct Effect -0.1965 0.1148 -1.71 .0875
Total Indirect -0.4505 0.0773 — —
Table 3.2. The second model: Mediation route analysis
Path Description Effect BootLLCI–ULCI
Ind1 JS → GG → LS -0.0027 [-0.0489, 0.0387]
Ind2 JS → SI → LS -0.0916** [-0.1647, -0.0255]
Ind3 JS → FH → LS -0.2936** [-0.4292, -0.1691]
Ind4 JS → GG → SI → LS -0.0141** [-0.0286, -0.0035]
Ind5 JS → GG → FH → LS -0.0137** [-0.0283, -0.0039]
Ind6 JS → SI → FH → LS -0.0302** [-0.0506, -0.0149]
Ind7 JS → GG → SI → FH → LS -0.0046** [-0.0087, -0.0018]
Table 3.3. The second model: Pathway effects output
Standardized
Pathway SE p-value
Coefficient (β)
Direct Effects
Job Insecurity → Life Satisfaction –.254*** .038 .000
Indirect Effects (Mediators)
JobInsecurity → GoalGrowth –.155*** .032 .000
GoalGrowth → LifeSatisfaction .129*** .031 .000
JobInsecurity → Social Impact .210*** .028 .000
Social Impact → LifeSatisfaction –.118*** .029 .000
JobInsecurity → Future Hope –.308*** .034 .000
Future Hope → LifeSatisfaction .228*** .033 .000
Model Fit Indices
Chi-square (χ²) 14.721 df = 2 .001
Comparative Fit Index (CFI) .997
Tucker-Lewis Index (TLI) .983
Root Mean Square Error of Approximation (RMSEA) .032
Standardized Root Mean Square Residual (SRMR) .008
Note: *p < .001 SE = Standard Error.
Fit indices indicate an excellent model fit according to conventional thresholds (CFI & TLI >
.95, RMSEA < .05, SRMR < .08).
62