
Page 77 - Azerbaijan State University of Economics
P. 77
Nurana Sadıgova, Magsud Mirzayev: Service Quality as a Determinant of Patient Satisfaction: An
Empirical Study in the Healthcare Sector
The demographic profile of the respondents, as presented in Table 1, provides key
insights into the characteristics of the study sample (N = 136).
Age: The majority of respondents (72.8%) are aged 35 years or younger, with 37.5%
under the age of 26 and 35.3% between 27 and 35 years. Participants aged 36–44
constitute 17.6%, while those aged 44 and above represent only 9.6%. This indicates
a predominantly young respondent base.
Gender: In terms of gender distribution, female participants account for a larger
proportion (61.0%) compared to their male counterparts (39.0%), suggesting a gender
imbalance in favor of women within the sample.
Marital Status: The sample includes slightly more single individuals (52.9%) than
married ones (47.1%), indicating a relatively balanced distribution across marital
status.
Education Level: A considerable majority of respondents (77.2%) hold a university
degree, while 14.7% have attained secondary education, and 8.1% possess vocational
or college-level qualifications. This reflects a highly educated sample population.
Monthly Income: Income distribution reveals that a substantial portion of
respondents (78.0%) earn 1,000 AZN or less per month, with 41.2% earning between
0–500 AZN and 36.8% earning 500–1,000 AZN. Only a small minority (5.1%) report
earning over 2,000 AZN, indicating that the sample predominantly comprises
individuals from lower to middle income brackets.
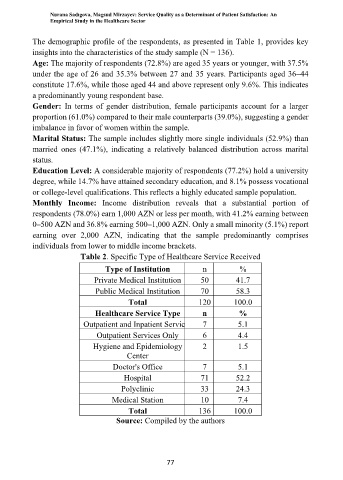
Table 2. Specific Type of Healthcare Service Received
Type of Institution n %
Private Medical Institution 50 41.7
Public Medical Institution 70 58.3
Total 120 100.0
Healthcare Service Type n %
Outpatient and Inpatient Services 7 5.1
Outpatient Services Only 6 4.4
Hygiene and Epidemiology 2 1.5
Center
Doctor's Office 7 5.1
Hospital 71 52.2
Polyclinic 33 24.3
Medical Station 10 7.4
Total 136 100.0
Source: Compiled by the authors
77