
Page 79 - Azerbaijan State University of Economics
P. 79
Nurana Sadıgova, Magsud Mirzayev: Service Quality as a Determinant of Patient Satisfaction: An
Empirical Study in the Healthcare Sector
RESEARCH FINDINGS
Reliability is determined based on the consistency of results obtained when
measurement tools and scales are reapplied under the same conditions. As the level of
reliability increases, the credibility of the data obtained from the measurement is also
considered to improve (Ahmadov et al., 2023). In this study, the reliability analysis
was conducted using the Cronbach’s Alpha coefficient.
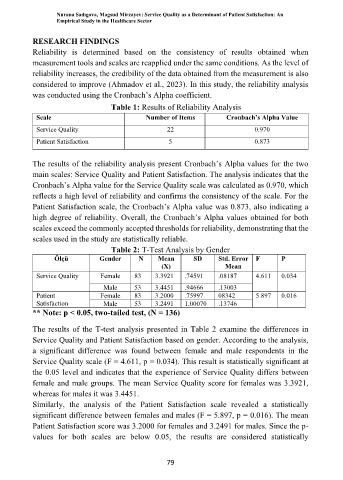
Table 1: Results of Reliability Analysis
Scale Number of Items Cronbach’s Alpha Value
Service Quality 22 0.970
Patient Satisfaction 5 0.873
The results of the reliability analysis present Cronbach’s Alpha values for the two
main scales: Service Quality and Patient Satisfaction. The analysis indicates that the
Cronbach’s Alpha value for the Service Quality scale was calculated as 0.970, which
reflects a high level of reliability and confirms the consistency of the scale. For the
Patient Satisfaction scale, the Cronbach’s Alpha value was 0.873, also indicating a
high degree of reliability. Overall, the Cronbach’s Alpha values obtained for both
scales exceed the commonly accepted thresholds for reliability, demonstrating that the
scales used in the study are statistically reliable.
Table 2: T-Test Analysis by Gender
Ölçü Gender N Mean SD Std. Error F P
(X) Mean
Service Quality Female 83 3.3921 .74591 .08187 4.611 0.034
Male 53 3.4451 .94666 .13003
Patient Female 83 3.2000 .75997 08342 5.897 0.016
Satisfaction Male 53 3.2491 1.00070 .13746
** Note: p < 0.05, two-tailed test, (N = 136)
The results of the T-test analysis presented in Table 2 examine the differences in
Service Quality and Patient Satisfaction based on gender. According to the analysis,
a significant difference was found between female and male respondents in the
Service Quality scale (F = 4.611, p = 0.034). This result is statistically significant at
the 0.05 level and indicates that the experience of Service Quality differs between
female and male groups. The mean Service Quality score for females was 3.3921,
whereas for males it was 3.4451.
Similarly, the analysis of the Patient Satisfaction scale revealed a statistically
significant difference between females and males (F = 5.897, p = 0.016). The mean
Patient Satisfaction score was 3.2000 for females and 3.2491 for males. Since the p-
values for both scales are below 0.05, the results are considered statistically
79