
Page 80 - Azerbaijan State University of Economics
P. 80
THE JOURNAL OF ECONOMIC SCIENCES: THEORY AND PRACTICE, V.82, # 1, 2025, pp. 70-88
significant. This analysis demonstrates that both Service Quality and Patient
Satisfaction differ significantly according to gender.
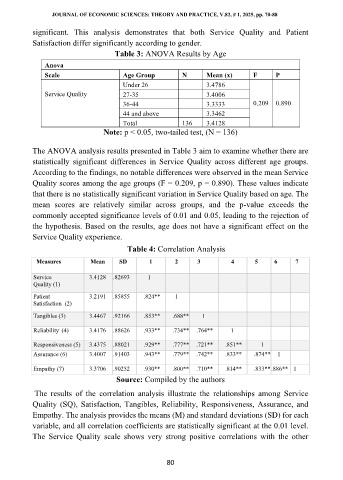
Table 3: ANOVA Results by Age
Anova
Scale Age Group N Mean (x) F P
Under 26 3.4786
Service Quality 27-35 3.4006
36-44 3.3333 0.209 0.890
44 and above 3.3462
Total 136 3.4128
Note: p < 0.05, two-tailed test, (N = 136)
The ANOVA analysis results presented in Table 3 aim to examine whether there are
statistically significant differences in Service Quality across different age groups.
According to the findings, no notable differences were observed in the mean Service
Quality scores among the age groups (F = 0.209, p = 0.890). These values indicate
that there is no statistically significant variation in Service Quality based on age. The
mean scores are relatively similar across groups, and the p-value exceeds the
commonly accepted significance levels of 0.01 and 0.05, leading to the rejection of
the hypothesis. Based on the results, age does not have a significant effect on the
Service Quality experience.
Table 4: Correlation Analysis
Measures Mean SD 1 2 3 4 5 6 7
Service 3.4128 .82693 1
Quality (1)
Patient 3.2191 .85855 .824** 1
Satisfaction (2)
Tangibles (3) 3.4467 .92166 .853** .688** 1
Reliability (4) 3.4176 .88626 .933** .734** .764** 1
Responsiveness (5) 3.4375 .88021 .929** .777** .721** .851** 1
Assurance (6) 3.4007 .91403 .943** .779** .742** .833** .874** 1
Empathy (7) 3.3706 .90252 .930** .800** .710** .814** .833** .886** 1
Source: Compiled by the authors
The results of the correlation analysis illustrate the relationships among Service
Quality (SQ), Satisfaction, Tangibles, Reliability, Responsiveness, Assurance, and
Empathy. The analysis provides the means (M) and standard deviations (SD) for each
variable, and all correlation coefficients are statistically significant at the 0.01 level.
The Service Quality scale shows very strong positive correlations with the other
80