
Page 126 - Azerbaijan State University of Economics
P. 126
Yadulla Hasanli, Gunay Rahimli, Fuad Quliyev, Mattia Ferrari: Evaluation of Sectoral
Foreign Trade Elasticities of Azerbaijan
defined as the sum of the value of domestically produced products sold on the local
market and the value of imported products. Imports by sector are denoted by M, the
value of domestic products sold on the local market by D, and the total demand for
goods and services in each sector by Q. Statistical data used to estimate the parameters
of the Armington functions for the aforementioned sectors are presented in Table 1. It
should be noted that all indicators expressed as percentages were entered into the
program developed in Mathcad. Based on this program, the parameters of the
Armington function were estimated, and possible adequacy tests were conducted.
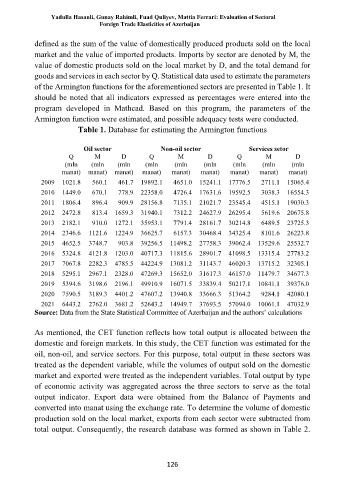
Table 1. Database for estimating the Armington functions
Oil sector Non-oil sector Services setor
Q M D Q M D Q M D
(mln (mln (mln (mln (mln (mln (mln (mln (mln
manat) manat) manat) manat) manat) manat) manat) manat) manat)
2009 1021.8 560.1 461.7 19892.1 4651.0 15241.1 17776.5 2711.1 15065.4
2010 1449.0 670.1 778.9 22358.0 4726.4 17631.6 19592.5 3038.3 16554.3
2011 1806.4 896.4 909.9 28156.8 7135.1 21021.7 23545.4 4515.1 19030.3
2012 2472.8 813.4 1659.3 31940.1 7312.2 24627.9 26295.4 5619.6 20675.8
2013 2182.1 910.0 1272.1 35953.1 7791.4 28161.7 30214.8 6489.5 23725.3
2014 2346.6 1121.6 1224.9 36625.7 6157.3 30468.4 34325.4 8101.6 26223.8
2015 4652.5 3748.7 903.8 39256.5 11498.2 27758.3 39062.4 13529.6 25532.7
2016 5324.8 4121.8 1203.0 40717.3 11815.6 28901.7 41098.5 13315.4 27783.2
2017 7067.8 2282.3 4785.5 44224.9 13081.2 31143.7 46020.3 13715.2 32305.1
2018 5295.1 2967.1 2328.0 47269.3 15652.0 31617.3 46157.0 11479.7 34677.3
2019 5394.6 3198.6 2196.1 49910.9 16071.5 33839.4 50217.1 10841.1 39376.0
2020 7590.5 3189.3 4401.2 47607.2 13940.8 33666.3 51364.2 9284.1 42080.1
2021 6443.2 2762.0 3681.2 52643.2 14949.7 37693.5 57094.0 10061.1 47032.9
Source: Data from the State Statistical Committee of Azerbaijan and the authors’ calculations
As mentioned, the CET function reflects how total output is allocated between the
domestic and foreign markets. In this study, the CET function was estimated for the
oil, non-oil, and service sectors. For this purpose, total output in these sectors was
treated as the dependent variable, while the volumes of output sold on the domestic
market and exported were treated as the independent variables. Total output by type
of economic activity was aggregated across the three sectors to serve as the total
output indicator. Export data were obtained from the Balance of Payments and
converted into manat using the exchange rate. To determine the volume of domestic
production sold on the local market, exports from each sector were subtracted from
total output. Consequently, the research database was formed as shown in Table 2.
126