
Page 128 - Azerbaijan State University of Economics
P. 128
Yadulla Hasanli, Gunay Rahimli, Fuad Quliyev, Mattia Ferrari: Evaluation of Sectoral
Foreign Trade Elasticities of Azerbaijan
As can be seen, the elasticity of substitution between domestic and imported products
in the oil sector is very close to unity. This indicates that locally produced goods in
this sector can effectively substitute imported goods. According to formula (3), the
elasticity of mutual substitution between imported and domestic products in the oil
sector is close to one, meaning that the ratio of the volume of imported goods sold in
the country to the volume of domestic goods remains approximately constant under
any price change. However, there is a slight tendency for the volume of domestic
products to exceed that of imported products. Based on calculation using expression
(3), a 1% increase in the import price results in a reduction of the ratio of imported to
domestic products by approximately 0.98%.
765
680
595
510
425
340
255
170
85
0
-85 2009 2010 2011 2012 2013 2014 2015 2016 2017 2018 2019 2020 2021
actual values fitted values
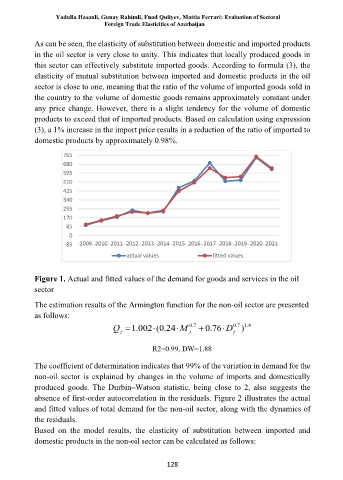
Figure 1. Actual and fitted values of the demand for goods and services in the oil
sector
The estimation results of the Armington function for the non-oil sector are presented
as follows:
Q = . 1 002 . 0 ( 24 M 7 . 0 + . 0 76 D 7 . 0 ) 4 . 1
j j j
R2=0.99, DW=1.88
The coefficient of determination indicates that 99% of the variation in demand for the
non-oil sector is explained by changes in the volume of imports and domestically
produced goods. The Durbin–Watson statistic, being close to 2, also suggests the
absence of first-order autocorrelation in the residuals. Figure 2 illustrates the actual
and fitted values of total demand for the non-oil sector, along with the dynamics of
the residuals.
Based on the model results, the elasticity of substitution between imported and
domestic products in the non-oil sector can be calculated as follows:
128