Page 130 - Azerbaijan State University of Economics
P. 130

Yadulla Hasanli, Gunay Rahimli, Fuad Quliyev, Mattia Ferrari: Evaluation of Sectoral
                                                           Foreign Trade Elasticities of Azerbaijan


                    This elasticity of substitution also indicates that the elasticity between domestic and
                    imported products in the service sector is close to unity. In other words, a 1% change
                    in  relative  prices  leads  to  an  approximately  proportional  change  in  the  ratio  of
                    imported to domestic products.

                             350
                             315
                             280
                             245
                             210
                             175
                             140
                             105
                              70
                              35
                               0
                              -35  2009 2010 2011 2012 2013 2014 2015 2016 2017 2018 2019 2020 2021
                                               actual values           fitted values


                           Figure 3. Actual and fitted values of total demand in the service sector

                    Estimation of the parameters of the CET function
                    The estimation of the CET function parameters for the oil sector yielded the
                    following results:
                                        Y =    . 0  97  . 0 (  92 E  j . 0  14  +  . 0  08 D  j . 0  14 )  9 . 6
                                          j
                                                        2
                                                       R =0.99, DW=2.07

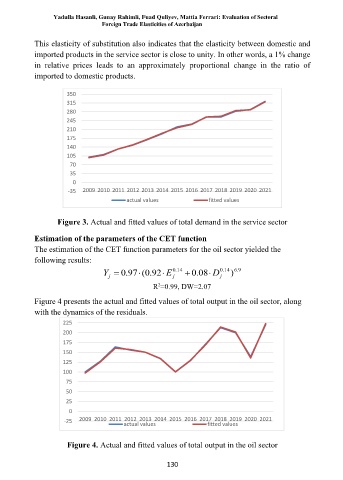
                    Figure 4 presents the actual and fitted values of total output in the oil sector, along
                    with the dynamics of the residuals.

                            225
                            200
                            175
                            150
                            125
                            100
                             75
                             50
                             25
                              0
                            -25  2009 2010 2011 2012 2013 2014 2015 2016 2017 2018 2019 2020 2021
                                              actual values            fitted values

                             Figure 4. Actual and fitted values of total output in the oil sector


                                                           130
   125   126   127   128   129   130   131   132   133   134   135