
Page 133 - Azerbaijan State University of Economics
P. 133
THE JOURNAL OF ECONOMIC SCIENCES: THEORY AND PRACTICE, V.82, # 2, 2025, pp. 117-137
DISCUSSION
Table 3 summarizes the estimated elasticities of the CET and Armington functions
for all three sectors.
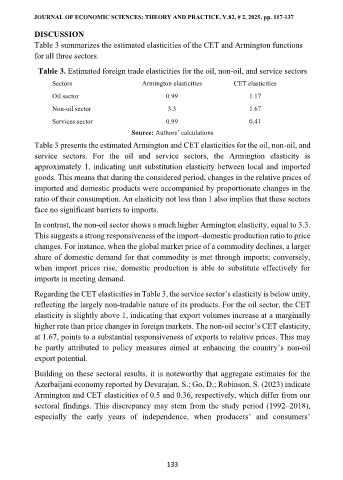
Table 3. Estimated foreign trade elasticities for the oil, non-oil, and service sectors
Sectors Armington elasticities CET elasticities
Oil sector 0.99 1.17
Non-oil sector 3.3 1.67
Services sector 0.99 0.41
Source: Authors’ calculations
Table 3 presents the estimated Armington and CET elasticities for the oil, non-oil, and
service sectors. For the oil and service sectors, the Armington elasticity is
approximately 1, indicating unit substitution elasticity between local and imported
goods. This means that during the considered period, changes in the relative prices of
imported and domestic products were accompanied by proportionate changes in the
ratio of their consumption. An elasticity not less than 1 also implies that these sectors
face no significant barriers to imports.
In contrast, the non-oil sector shows a much higher Armington elasticity, equal to 3.3.
This suggests a strong responsiveness of the import–domestic production ratio to price
changes. For instance, when the global market price of a commodity declines, a larger
share of domestic demand for that commodity is met through imports; conversely,
when import prices rise, domestic production is able to substitute effectively for
imports in meeting demand.
Regarding the CET elasticities in Table 3, the service sector’s elasticity is below unity,
reflecting the largely non-tradable nature of its products. For the oil sector, the CET
elasticity is slightly above 1, indicating that export volumes increase at a marginally
higher rate than price changes in foreign markets. The non-oil sector’s CET elasticity,
at 1.67, points to a substantial responsiveness of exports to relative prices. This may
be partly attributed to policy measures aimed at enhancing the country’s non-oil
export potential.
Building on these sectoral results, it is noteworthy that aggregate estimates for the
Azerbaijani economy reported by Devarajan, S.; Go, D.; Robinson, S. (2023) indicate
Armington and CET elasticities of 0.5 and 0.36, respectively, which differ from our
sectoral findings. This discrepancy may stem from the study period (1992–2018),
especially the early years of independence, when producers’ and consumers’
133