
Page 31 - Azerbaijan State University of Economics
P. 31
N.Akimov., S.Baizakov., A. Oinarov., E.Utembayev: The analysis of the macroeconomic
dynamics and assessment of smart factors’ inputs to the balanced growth rates
the economy where the demand for goods and services surpasses the volume of the
final product.
In this connection, the targeting of prices on goods and services, as one of the
methods of the anti-crisis management, becomes a serious bottleneck in the way of
defining the real growth of the economy. As indicated above, this topic has been
explained, in greater detail, by Thomas Piketty.
The price deflator GDP (indicator of inflation) indeed represents a combined
factor, consisting of the component that possesses not only the destructive but also
developing power in relation to a market economy. The study of its structure may
help in analyzing the differences between the rates of implementation of the science
and technology, and finance, and social, and political innovations.
The final outcome of such study may be the assessment of the quality of the
innovations-based input to the development of national economy. Thus, the
assessment of the innovations-based contribution of entrepreneurs is defined by the
level of inflation\deflation, production costs. The assessment of the quality of the
innovations-driven contribution to finance is defined by the level of
depreciation/appreciation of money, national currency (рр). The assessment of the
innovations-based input by the corporate management structures, particularly, their
decisions making effectiveness, and of public and private partnerships is defined by
the quality and the level of the science and technology potential in the country (с).
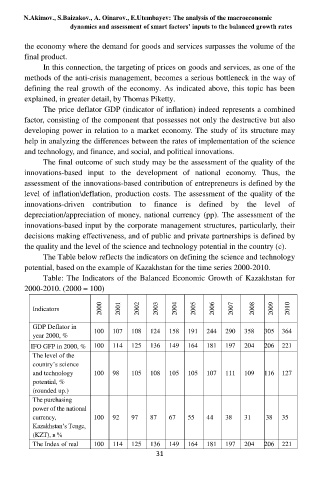
The Table below reflects the indicators on defining the science and technology
potential, based on the example of Kazakhstan for the time series 2000-2010.
Table: The Indicators of the Balanced Economic Growth of Kazakhstan for
2000-2010. (2000 = 100)
Indicators 2000 2001 2002 2003 2004 2005 2006 2007 2008 2009 2010
GDP Deflator in 100 107 108 124 158 191 244 290 358 305 364
year 2000, %
IFO GFP in 2000, % 100 114 125 136 149 164 181 197 204 206 221
The level of the
country‘s science
and technology 100 98 105 108 105 105 107 111 109 116 127
potential, %
(rounded up.)
The purchasing
power of the national
currency, 100 92 97 87 67 55 44 38 31 38 35
Kazakhstan‘s Tenge,
(KZT), в %
The Index of real 100 114 125 136 149 164 181 197 204 206 221
31